
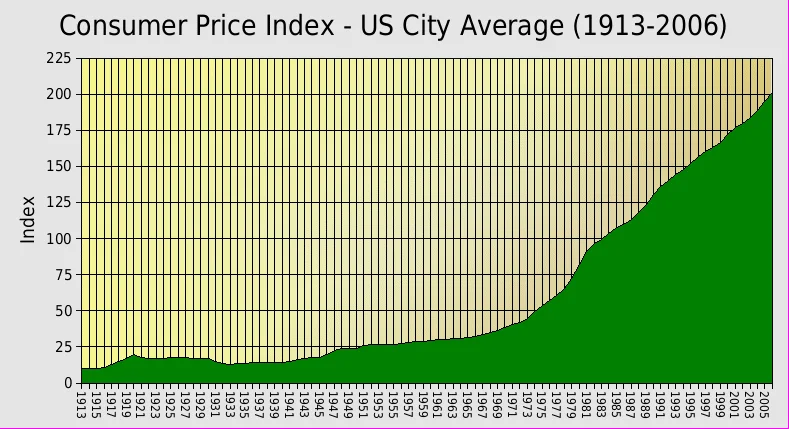
Historical US city-average CPI, 1913–2006: a comparative example, not Indian inflation evidence.
Credit: Analoguni at English Wikipedia · Public domain · sourceResized and converted to WebP; uncropped.
1. What CPI measures
CPI tracks the average change over time in prices paid by consumers for a specified consumption basket. Retail prices matter because households purchase goods and services at the final stage of distribution. An increase in CPI indicates that purchasing the representative basket has become more expensive. However, CPI is an average: a household spending heavily on rent, education or medicines may experience inflation different from the published rate.
An index and an inflation rate are different concepts. With a base of 100, an index value of 180 indicates that the measured basket’s price level is approximately 80% above its base-period level. It does not mean current annual inflation is 80%. Year-on-year inflation is calculated as: [(CPI in the current month ÷ CPI in the corresponding month of the previous year) − 1] × 100. Thus, an increase from 180 to 189 represents 5% inflation.
Disinflation means that prices are increasing more slowly, whereas deflation means a decline in the general price level. If inflation falls from 7% to 4%, consumers still face rising prices. CPI is also distinct from a complete cost-of-living index: a fixed basket cannot fully capture changing consumer choices, differences in personal circumstances or all improvements in product quality.
- Year-on-year comparison reduces the influence of recurring seasonal patterns but remains sensitive to the previous year’s comparison base.
- Month-on-month inflation measures the change from the immediately preceding month; seasonal movements require careful interpretation.
- Purchasing power falls when consumer prices rise faster than nominal household income.
2. India’s CPI architecture and basket
NSO publishes separate rural and urban indices and a combined all-India index. These recognise differences in expenditure patterns and prices across settlement types. CPI-Combined is constructed using expenditure-based aggregation, not a simple arithmetic average of rural and urban inflation rates. State-level indices also help reveal geographical differences that an all-India figure can conceal.
For the 2012-base series, expenditure weights were derived from the National Sample Survey’s 2011–12 Consumer Expenditure Survey using the Modified Mixed Reference Period approach. Prices are collected from selected rural and urban markets. The index uses fixed expenditure weights and Laspeyres-type aggregation; geometric means are used at the elementary item-price level. This structure makes both price movements and household expenditure shares important.
The basket contains six major groups: food and beverages; pan, tobacco and intoxicants; clothing and footwear; housing; fuel and light; and miscellaneous. The miscellaneous group includes important services such as health, education, transport and communication. Housing is represented in the urban index but not as a separate group in CPI-Rural. Food and beverages have a larger weight in the rural basket than in the urban basket.
The Consumer Food Price Index (CFPI) is a separately published measure covering selected food subgroups. It should not be treated as identical to the entire food and beverages group: their coverage differs. Likewise, CPI fuel and light is not a complete measure of every household energy expense; petrol and diesel used for personal transport appear under transport and communication.
- CPI-Combined weights in the 2012-base series: food and beverages 45.86%; pan, tobacco and intoxicants 2.38%; clothing and footwear 6.53%.
- The remaining weights are housing 10.07%; fuel and light 6.84%; and miscellaneous 28.32%.
- Always identify the base year when using weights; rebasing can change the basket, expenditure shares and compilation arrangements.
From household consumption to CPI inflation
- 1. Use household expenditure data to select the basket and determine weights.
- 2. Collect retail prices from sampled markets and other specified sources.
- 3. Construct item-level indices relative to the base period.
- 4. Aggregate indices using expenditure weights.
- 5. Calculate inflation and examine component contributions and base effects.
3. Reading CPI movements correctly
Headline inflation covers the complete CPI basket. Core inflation generally excludes food and fuel to identify relatively persistent price pressures. However, there is no single universally binding definition of core inflation: analytical measures may exclude additional volatile items. Core inflation is useful, but it cannot replace headline inflation when assessing households’ actual consumption burden.
A component’s influence depends on both its inflation rate and its expenditure weight. A sharp vegetable-price increase can materially affect headline inflation, while a similarly large increase in a very low-weight item may have little effect. As a first approximation, multiplying a group’s weight by its inflation rate indicates its contribution; precise decomposition requires the relevant index levels and aggregation method.
Base effects arise because annual inflation compares today’s prices with prices a year earlier. If last year’s comparison-month prices were unusually high, annual inflation may fall even while the current index rises. Conversely, a low comparison base can produce high annual inflation without a sudden current-month price surge. Examiners often test this distinction between price levels and the rate of change.
Inflation can originate from excess demand, production bottlenecks, imported commodity costs, currency depreciation, taxes or weather-related supply shocks. Persistent food inflation may also influence wage demands and inflation expectations. Therefore, an initially sector-specific shock can spread into broader inflation through second-round effects.
- Read headline CPI alongside food inflation, core measures, rural–urban differences and month-on-month changes.
- Check whether inflation is concentrated in a few commodities or broad-based across goods and services.
- A lower inflation rate does not establish that essential goods have become cheaper.
| Measure | Compiler | Coverage or purpose |
|---|---|---|
| CPI-Rural, Urban and Combined | NSO, MoSPI | Consumer goods and services; CPI-Combined anchors inflation targeting |
| CFPI | NSO, MoSPI | Selected food subgroups; narrower than the full food and beverages group |
| CPI-IW | Labour Bureau | Industrial-worker households; wage and dearness allowance adjustment |
| CPI-AL and CPI-RL | Labour Bureau | Agricultural-labourer and rural-labourer households |
| WPI | Office of the Economic Adviser, DPIIT | Goods prices; excludes services |
4. CPI, monetary policy and public policy
The Reserve Bank of India Act, 1934, as amended in 2016, provides the statutory basis for flexible inflation targeting. The Central Government determines the inflation target in consultation with RBI once every five years. The notified target for April 2021–March 2026 was 4% CPI inflation with a tolerance band of 2–6%. This dated notification should not be assumed to cover subsequent periods without checking the applicable government notification.
Under this framework, failure is defined by average inflation exceeding the upper tolerance level or falling below the lower tolerance level for three consecutive quarters. A single monthly reading outside the band does not by itself constitute statutory failure. On failure, RBI must submit a report to the Central Government explaining the reasons, proposed remedial measures and estimated time needed to return inflation to target.
Monetary policy affects inflation through interest rates, credit conditions, demand and expectations, generally with a lag. It cannot immediately produce vegetables or reverse crop damage. Nevertheless, it can limit the spread of supply shocks into generalised inflation. Government measures such as buffer-stock releases, improved logistics and calibrated import policies can address specific supply constraints, although interventions involve fiscal, trade and producer-incentive trade-offs.
- CPI-IW, compiled by the Labour Bureau, is used in dearness allowance and wage-adjustment arrangements; it is not the monetary policy target index.
- CPI supports analysis of real wages, real consumption and household welfare, but different purposes may require different price deflators.
5. Limitations and examination traps
Fixed baskets gradually become less representative as incomes, technology and consumption habits change. Consumers may substitute cheaper products when relative prices shift, but a fixed-weight index does not immediately reflect that response. Quality adjustment, new products, informal service prices and geographical variation create additional measurement challenges. Periodic rebasing and updated expenditure surveys are therefore essential.
WPI measures prices of goods at the wholesale or producer-related stage and excludes services, whereas CPI covers consumer goods and services at retail. The GDP deflator has a different scope: it reflects prices of domestically produced final goods and services rather than a fixed household basket. Neither WPI nor the GDP deflator should be treated as interchangeable with CPI.
For an examination answer, connect measurement with welfare. Food-intensive households can suffer disproportionately during food-price shocks, even when aggregate inflation appears moderate. A sound policy assessment therefore combines credible inflation control with targeted support for vulnerable households and improvements in agricultural supply chains, storage, competition and market information.
- Do not confuse lower inflation with falling prices, CPI-Combined with CPI-IW, or CFPI with the full food and beverages group.
- Always attach the relevant base year to numerical basket weights and the applicable period to inflation-target notifications.
Reading CPI: Price Levels versus Inflation
The supplied metadata identifies a historical US city-average Consumer Price Index series using data attributed to the US Bureau of Labor Statistics. It is directly relevant as a comparative illustration of CPI over time, but it does not establish India’s inflation experience. CPI tracks the cost of a representative household consumption basket relative to a reference period. An index value is therefore a measure of the price level, whereas inflation is the percentage change in that index over a specified interval. A rising CPI can coexist with falling inflation: prices are still increasing, but more slowly.
For India, CPI interpretation requires attention to the chosen series, basket weights and comparison period. CPI Combined brings together rural and urban consumer price movements and is the reference measure for India’s inflation-targeting framework. Food price movements can substantially influence headline inflation, while households experience different cost pressures because their spending patterns differ from the representative basket. The historical US series cannot supply Indian basket weights, base years or policy conclusions. Its metadata also does not establish the chart’s precise index reference base, so numerical interpretation requires consulting the underlying series.
- Year-on-year CPI inflation equals [(current index ÷ index twelve months earlier) − 1] × 100; it is not the index-point difference.
- Disinflation means slower price increases; deflation means a falling price level. Base effects can change measured inflation without a comparable change in current price momentum.
- CPI covers household goods and services; India’s WPI primarily tracks goods at wholesale prices. Neither basket necessarily matches an individual household’s expenditure.
Real-world case studies
Vegetable-price shock, July 2023
India’s CPI-Combined inflation rose to 7.44% in July 2023, with a sharp increase in vegetable prices, especially tomatoes. The episode illustrates how perishable-food supply disruptions can lift headline inflation rapidly and why aggregate inflation must be read alongside component-level data.
Inflation-target failure in 2022
Average CPI inflation remained above 6% for three consecutive quarters during January–September 2022. This triggered the statutory accountability requirement, and RBI submitted a report to the Central Government. The episode demonstrates that the failure test concerns consecutive quarterly averages, not isolated monthly breaches.
Previous year questions
UPSC Prelims 2020
Consider the statements: 1. Food has a higher weight in CPI than in WPI. 2. WPI does not capture services-price changes, whereas CPI does. 3. RBI has adopted WPI as its key inflation measure for monetary policy. Which statements are correct?
- A. 1 and 2 only
- B. 2 only
- C. 3 only
- D. 1, 2 and 3
Practice questions
Practice MCQ 1
CPI rises from 160 to 168 in one year and from 168 to 173.04 in the next. Which conclusion is correct?
- A. Prices fell in the second year.
- B. Inflation increased from 3% to 5%.
- C. Inflation declined from 5% to 3%, while the price level increased.
- D. The second year experienced deflation.
Practice MCQ 2
Regarding the 2012-base CPI series, consider: 1. Housing is a separate group in CPI-Rural. 2. CPI-Combined is the simple arithmetic average of rural and urban inflation rates. 3. Expenditure weights affect a component’s influence on the aggregate index. Which statements are correct?
- A. 1 and 2 only
- B. 3 only
- C. 2 and 3 only
- D. 1, 2 and 3
Practice MCQ 3
A high comparison base can cause year-on-year CPI inflation to decline even when:
- A. The current month’s CPI increases over the preceding month.
- B. Every commodity necessarily becomes cheaper.
- C. The current index must fall below 100.
- D. Consumer prices stop being collected.
Mains practice · Explain how CPI measures consumer inflation in India. Why must changes in headline inflation be interpreted alongside basket weights, base effects and the nature of price shocks? Discuss in 250 words.
- Define CPI and distinguish the index level from its inflation rate.
- Explain rural, urban and combined indices and expenditure-based weights.
- Discuss food’s importance, base effects and headline versus core inflation.
- Differentiate demand pressures from temporary supply shocks and second-round effects.
- Connect CPI to monetary policy, household welfare and complementary supply-side measures.
- Mention basket obsolescence, substitution and household-specific inflation.
Further reading
- MoSPI: CPI monthly press releases and methodological documentation for the 2012-base series.
- RBI: Monetary Policy Reports and the inflation-targeting framework.
- Reserve Bank of India Act, 1934: provisions on monetary policy and inflation targeting.
- Labour Bureau: documentation on CPI-IW, CPI-AL and CPI-RL.
- NCERT: Introductory Macroeconomics, National Income Accounting.
- Office of the Economic Adviser, DPIIT: WPI technical documentation.
- https://commons.wikimedia.org/wiki/File:US_cities_consumer_price_index_1913-2006.gif
Preparing for UPSC Civil Services? Get classroom teaching, answer-writing evaluation and mentorship at Pragnya IAS Academy, Ashok Nagar — see why aspirants choose us for IAS coaching in Hyderabad.