
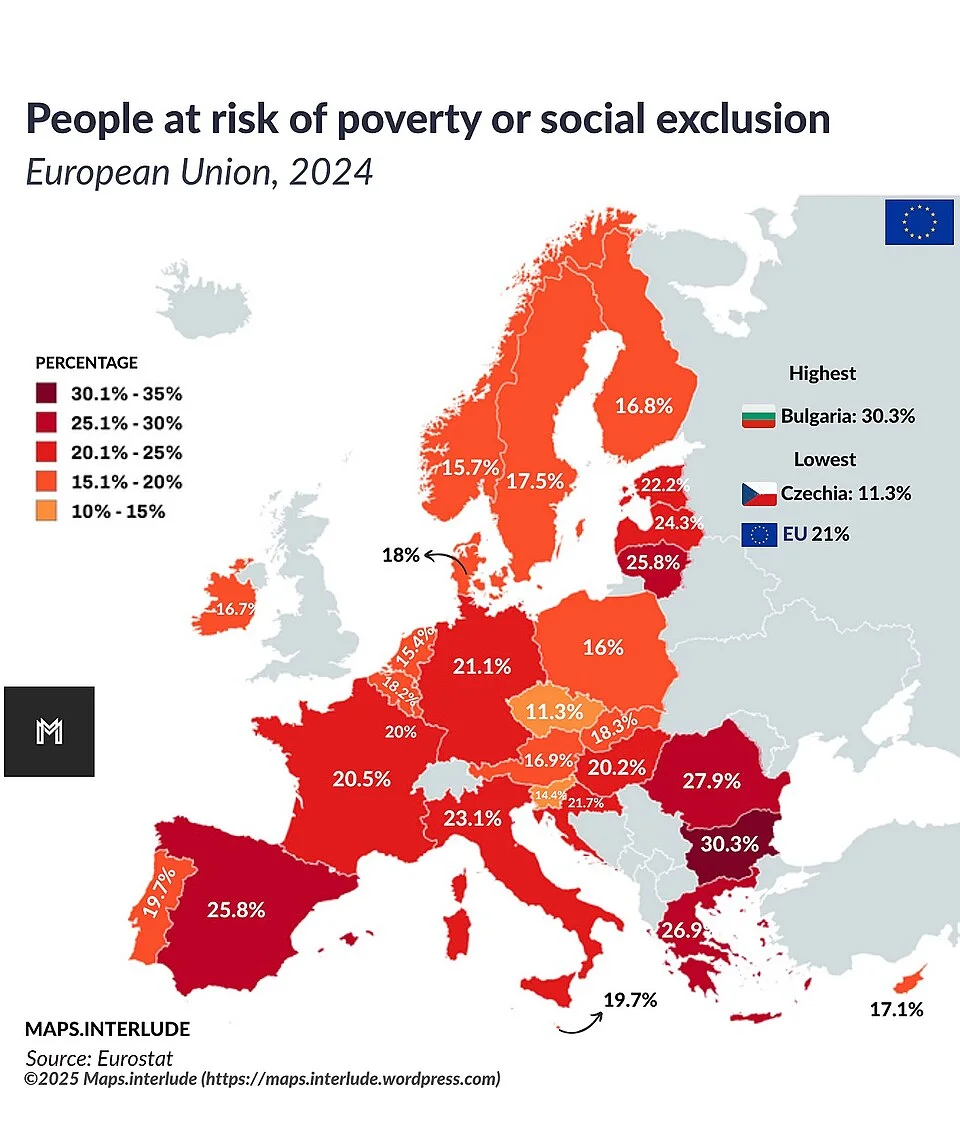
People at risk of poverty or social exclusion in the EU and Norway: a comparative poverty-measurement example.
Credit: Maps.interlude · CC BY 4.0 · sourceResized and converted to WebP; uncropped.
1. Meaning and dimensions of poverty
Poverty is both an economic condition and a restriction on human freedom. Monetary poverty refers to insufficient income or consumption to meet a specified minimum standard. Absolute poverty uses a threshold representing basic needs, while relative poverty assesses disadvantage against prevailing living standards. Relative measures highlight exclusion and inequality even where extreme deprivation has declined. Poverty and inequality are related but distinct: poverty can fall while the distribution of income becomes more unequal.
Amartya Sen’s capability approach views development as an expansion of substantive freedoms. A person may possess some income yet lack the ability to remain healthy, become educated or participate in society because services are unavailable or discrimination limits access. Multidimensional poverty captures overlapping disadvantages that monetary indicators alone cannot adequately describe.
Chronic poverty persists over long periods and may be transmitted across generations through malnutrition, poor schooling, insecure assets and unequal social relations. Transient poverty arises from events such as illness, unemployment, crop failure or displacement. Vulnerability describes the risk of becoming poor in future. An inclusive strategy must therefore help households escape deprivation and prevent those just above a poverty threshold from falling back below it.
- Rural poverty often involves low agricultural productivity, insecure land access, seasonal employment and weak connectivity.
- Urban poverty combines insecure earnings with high housing costs, overcrowding, informality and inadequate access to basic services.
Timeline
1993
The Lakdawala Expert Group submitted its report on estimating the proportion and number of poor people.
2009
The Tendulkar Committee recommended a revised methodology for monetary poverty estimation.
2013
The Planning Commission released Tendulkar-based poverty estimates for 2011–12; the National Food Security Act was enacted.
2014
The Rangarajan Committee proposed alternative poverty lines and estimates.
2021–2023
NITI Aayog released the National MPI baseline report in 2021 and its progress review in 2023.
2. Measurement of poverty in India
India has traditionally estimated monetary poverty using household consumption expenditure rather than income, partly because informal and seasonal incomes are difficult to measure reliably. A poverty line separates those below a minimum consumption threshold from those above it. The headcount ratio measures the proportion below the line, but ignores how far below it they are. The poverty gap captures the average shortfall from the poverty line, expressed relative to that line, while squared-gap measures give greater weight to the poorest.
The Lakdawala Expert Group, reporting in 1993, retained poverty lines anchored in earlier calorie-based norms and used separate rural and urban price indices. The Tendulkar Committee, reporting in 2009, moved away from directly anchoring poverty lines to calorie norms and improved recognition of private health and education expenditure. Under its methodology, the Planning Commission estimated poverty at 21.9% in 2011–12. The Rangarajan Committee, reporting in 2014, proposed a different consumption basket and estimated 29.5% for the same year; its recommendations did not replace Tendulkar-based official estimates.
NITI Aayog’s National MPI complements monetary measurement. Its 12 indicators include nutrition, child and adolescent mortality, maternal health, schooling, school attendance, cooking fuel, sanitation, drinking water, electricity, housing, assets and bank accounts. Each of the three dimensions carries equal weight. The MPI equals the headcount ratio multiplied by the average intensity of deprivation among the poor. Thus, it distinguishes the number of poor people from the breadth of their simultaneous deprivations.
- A monetary poverty line is an analytical threshold, not automatically an eligibility rule for every welfare scheme.
- World Bank international poverty lines support cross-country comparison using purchasing power parity; they should not be confused with India’s national poverty lines.
A durable pathway out of poverty
- 1. Identify households facing monetary deprivation, capability deficits and high risks
- 2. Protect food consumption and provide timely social assistance
- 3. Ensure nutrition, healthcare, quality education and basic amenities
- 4. Expand productive employment, assets and access to markets
- 5. Build portable protection against illness, unemployment and climate shocks
- 6. Track sustained improvements through surveys and accountable local delivery
3. Trends, achievements and interpretive cautions
NITI Aayog’s 2023 National MPI progress review, based on NFHS surveys, found that multidimensional poverty declined from 24.85% in 2015–16 to 14.96% in 2019–21. Approximately 13.5 crore people exited multidimensional poverty between these periods. Rural incidence fell from 32.59% to 19.28%, while urban incidence declined from 8.65% to 5.27%. These changes indicate improvements across basic capabilities and household amenities, although substantial regional and social disparities remained.
A separate NITI Aayog discussion paper released in January 2024 estimated a decline from 29.17% in 2013–14 to 11.28% in 2022–23, implying approximately 24.82 crore people escaping multidimensional poverty. These endpoint figures were estimated using changes observed between available NFHS rounds; they were not direct measurements from surveys conducted in those endpoint years. Examination answers should clearly distinguish these estimates from observed NFHS-based results.
The Household Consumption Expenditure Surveys for 2022–23 and 2023–24 provide newer consumption evidence. However, updated monetary poverty calculations depend on the poverty threshold, price adjustments and survey comparability. Changes in questionnaires, multiple visits and treatment of items received free through welfare schemes require careful interpretation. Neither higher average consumption nor lower multidimensional poverty, by itself, establishes that economic insecurity has disappeared. National averages can also conceal deprivation among migrants, Scheduled Tribes, persons with disabilities and disadvantaged localities.
- Always identify the measure, reference period, source and methodology before quoting a poverty figure.
- Access indicators need quality checks: an electricity connection does not guarantee reliable supply, and school attendance does not establish adequate learning.
| Measure | Main information | Key limitation |
|---|---|---|
| Monetary headcount ratio | Share below a specified poverty line | Does not capture the depth of poverty |
| Poverty gap index | Average normalised shortfall from the poverty line across the population | Does not fully capture inequality among poor people |
| Multidimensional Poverty Index | Incidence and intensity of overlapping deprivations | Sensitive to indicator selection, weights and cut-offs |
| Relative poverty measure | Disadvantage against prevailing income or consumption standards | Does not directly establish an absolute basic-needs shortfall |
4. Structural causes and the growth–poverty relationship
Economic growth reduces poverty when it raises the demand for labour, improves productivity and generates public revenue for essential services. Its poverty-reducing effect depends on the sectors and regions where expansion occurs, initial inequality and the ability of poor households to participate. Employment-intensive manufacturing, construction and services can create pathways out of low-productivity work, but insecure jobs with low real earnings may leave households vulnerable despite rising GDP.
India’s structural constraints include fragmented agricultural holdings, limited non-farm opportunities, unequal access to credit and skills, and a large informal workforce. Caste, gender and location shape access to assets and markets. Women’s unpaid care responsibilities can restrict paid employment, while inadequate childcare and unsafe transport reinforce exclusion. Low educational quality limits mobility even when enrolment improves.
Health expenditure, climate shocks and indebtedness can reverse gains. A serious illness may require borrowing or asset sales; drought or flooding can simultaneously reduce farm output, employment and food access. Childhood undernutrition and poor learning create intergenerational poverty traps by weakening future productivity. Poverty reduction therefore requires both redistribution and structural transformation: transfers protect minimum consumption, while productive assets, public services and decent employment expand sustained earning capacity.
- Growth is necessary for durable poverty reduction, but its distribution and employment content matter.
- Redistribution supports inclusion, but cannot substitute indefinitely for productive livelihoods and capable public institutions.
5. Policy framework and priorities
The Constitution provides a normative basis for poverty reduction through Articles 38, 39 and 41, alongside Article 46 on the educational and economic interests of weaker sections. India’s policy architecture combines legal entitlements, public services, livelihood promotion and social assistance. MGNREGA guarantees at least 100 days of unskilled manual wage employment in a financial year to a rural household whose adult members volunteer for such work. The National Food Security Act, 2013 establishes food and nutritional entitlements, including subsidised foodgrain coverage for up to 75% of the rural and 50% of the urban population.
DAY-NRLM promotes women’s self-help groups and livelihood institutions, while PMAY addresses housing deprivation. Ayushman Bharat combines primary healthcare strengthening with hospitalisation protection for eligible groups through PM-JAY. These interventions address different risks and should be assessed together rather than treated as interchangeable solutions. Hospital insurance, for example, cannot substitute for accessible primary care, affordable outpatient treatment and disease prevention.
Priorities include labour-intensive growth, agricultural diversification, quality foundational education, nutrition, universal access to essential healthcare and stronger urban social protection. Portability through One Nation One Ration Card helps eligible migrants access food entitlements away from home. Effective delivery requires updated beneficiary databases, accessible enrolment, timely payments, social audits and grievance redress. Digital systems should reduce transaction costs without making connectivity or authentication failures grounds for exclusion. Success should be judged through real earnings, service quality, reduced vulnerability and movement out of poverty that persists over time.
- Use area-specific strategies for tribal regions, rain-fed districts, informal settlements and climate-vulnerable areas.
- Combine consumption support with skills, affordable credit, market access, childcare and productive infrastructure.
- Monitor exclusion errors, deprivation intensity and repeated entry into poverty, not only aggregate headcount reductions.
Poverty, Vulnerability and Social Exclusion
The supplied metadata identifies a European example of people at risk of poverty or social exclusion. It is relevant as a comparative illustration, not as evidence about poverty levels in India. The European framework combines distinct dimensions: relative income poverty, material and social deprivation, and very low household work intensity. A person meeting any one of these conditions can fall within the combined indicator; the component totals should therefore not simply be added, because they overlap.
This approach highlights why poverty cannot be understood through income alone. Relative income poverty concerns a household’s position within its society’s income distribution, whereas deprivation concerns its inability to afford specified necessities. Limited access to employment can compound both disadvantages. For India, consumption-based poverty estimates and multidimensional poverty measures answer different questions and should be read alongside employment quality, nutrition and access to public services. The metadata does not establish the reference year, indicator version or underlying values, so the image cannot support numerical comparisons or claims about trends.
- Measurement distinction: India’s National Multidimensional Poverty Index assesses health, education and living standards; it is not interchangeable with the European combined indicator.
- Prelims caution: Relative poverty can persist despite rising average incomes; economic growth does not automatically reduce inequality or social exclusion.
- Mains linkage: Inclusive growth requires productive employment, accessible public services and social protection against shocks. Evaluate both poverty reduction and the security of households near a poverty threshold.
Real-world case studies
Kerala’s Kudumbashree: collective institutions for inclusion
Launched in 1998, Kudumbashree links women’s neighbourhood groups with area and community development societies. Its activities include thrift, credit, microenterprises and collective farming, supported by local-government participation. It illustrates how poverty reduction can combine livelihoods with women’s agency and community organisation. Replication requires institutional support, viable markets and safeguards against excessive indebtedness; forming groups alone does not guarantee higher incomes.
MGNREGA: protection with productive asset creation
MGNREGA links a statutory employment guarantee with public works such as water conservation and land development. It can smooth rural consumption during agricultural lean seasons while improving the local resource base. Its expanded use during the COVID-19 disruption demonstrated the importance of demand-responsive protection. Delayed wages, unmet work demand and uneven implementation show why an entitlement must be backed by adequate financing and administrative capacity.
Previous year questions
No source-linked PYQ is available here yet. Use the practice questions below.
Practice questions
Practice MCQ 1
Consider the following statements about poverty measurement: 1. The headcount ratio reveals how far poor households fall below the poverty line. 2. The poverty gap index captures the normalised shortfall from the poverty line. 3. A decline in monetary poverty necessarily implies a decline in income inequality. Which of the statements given above is/are correct?
- A. 1 and 2 only
- B. 2 only
- C. 2 and 3 only
- D. 1, 2 and 3
Practice MCQ 2
With reference to India’s National Multidimensional Poverty Index, consider the following statements: 1. It includes health, education and standard of living. 2. A person is identified as multidimensionally poor when deprived in at least one-third of weighted indicators. 3. Its value is calculated by adding incidence and intensity. Which of the statements given above are correct?
- A. 1 and 2 only
- B. 2 and 3 only
- C. 1 and 3 only
- D. 1, 2 and 3
Practice MCQ 3
Which of the following best describes the employment entitlement under MGNREGA?
- A. At least 100 days of skilled employment for every unemployed individual
- B. At least 100 days of unskilled manual wage employment per financial year for an eligible rural household whose adult members volunteer
- C. A fixed monthly unemployment allowance for all rural residents
- D. Guaranteed year-round employment for all below-poverty-line households
Mains practice · Declining poverty ratios are necessary but insufficient evidence of inclusive development. Discuss with reference to poverty measurement and the persistence of economic vulnerability in India. Suggest a strategy for durable poverty reduction. Answer in 250 words.
- Distinguish monetary poverty, multidimensional deprivation and vulnerability.
- Use dated Tendulkar and National MPI estimates without treating them as directly comparable.
- Explain the limitations of headcount ratios, national averages and service-access indicators.
- Examine informal employment, health expenditure, social exclusion and climate shocks.
- Integrate employment-intensive growth with nutrition, education, healthcare and portable social protection.
- Conclude with sustained capability expansion, real-income gains and accountable delivery as tests of inclusion.
Further reading
- NCERT, Indian Economic Development, chapter on Poverty in editions containing that chapter.
- Planning Commission, Press Note on Poverty Estimates, 2011–12, July 2013.
- Planning Commission, Report of the Expert Group to Review the Methodology for Estimation of Poverty, 2009; Rangarajan Expert Group Report, 2014.
- NITI Aayog, National Multidimensional Poverty Index: A Progress Review 2023.
- NITI Aayog, Multidimensional Poverty in India since 2005–06, discussion paper, January 2024.
- Ministry of Statistics and Programme Implementation, Household Consumption Expenditure Survey reports, 2022–23 and 2023–24.
- Ministry of Rural Development, MGNREGA Act, operational guidelines and annual reports.
- https://commons.wikimedia.org/wiki/File:People_at_risk_of_poverty_or_social_exclusion.jpg
Preparing for UPSC Civil Services? Get classroom teaching, answer-writing evaluation and mentorship at Pragnya IAS Academy, Ashok Nagar — see why aspirants choose us for IAS coaching in Hyderabad.