
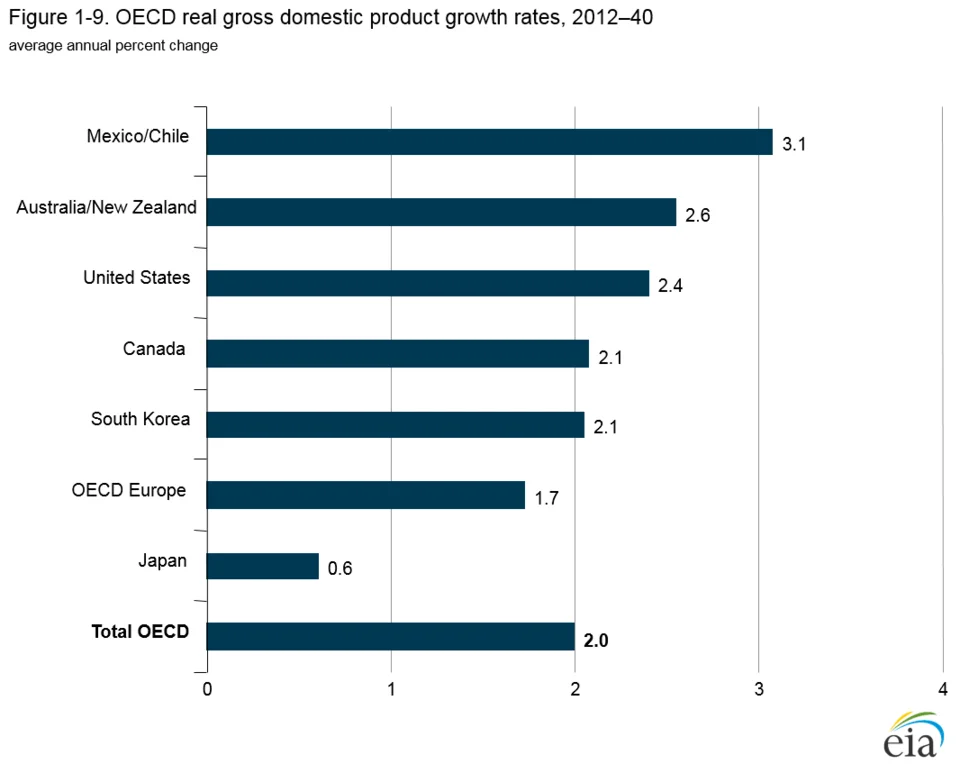
OECD real GDP growth projections for 2012–2040 in the IEO2016 Reference case; a comparative, non-Indian example.
Credit: U.S. Energy Information Administration · Public domain · sourceResized and converted to WebP; uncropped.
1. Meaning and scope of real GDP
Gross domestic product is the value of final goods and services produced within the domestic economic territory during a specified period, normally a quarter or a financial year. Domestic refers to the location of production, not the nationality of the producer. Production by a foreign-owned factory operating in India contributes to Indian GDP. Production by an Indian-owned factory abroad contributes to the GDP of the country where that production takes place.
GDP measured at current prices is nominal GDP. It values each period’s output using that period’s prices, so an increase can reflect inflation rather than a larger volume of production. Real GDP removes the effect of price changes and therefore provides a more meaningful basis for comparing production over time. In a simple fixed-base framework, current quantities are valued at the prices of a selected base year.
Suppose an economy produces only rice: 100 tonnes at ₹20,000 per tonne in the base year and 110 tonnes at ₹22,000 in the next year. Nominal GDP rises from ₹20 lakh to ₹24.2 lakh, or 21%. At base-year prices, the second year’s real GDP is ₹22 lakh, representing 10% growth. The remaining difference arises from higher prices and the interaction between price and quantity changes.
Final goods are counted to avoid double counting intermediate inputs. Alternatively, statisticians sum value added at successive production stages. Gross means that consumption of fixed capital, commonly called depreciation, has not been deducted. Subtracting it yields net domestic product, not real GDP.
- Real versus nominal distinguishes constant-price measurement from current-price measurement.
- Gross versus net distinguishes whether depreciation has been deducted.
- Domestic versus national distinguishes territorial production from income accruing to resident institutional units.
2. Measurement, base years and the GDP deflator
In a simplified fixed-base model, real GDP equals the sum of current-period quantities multiplied by base-year prices. Actual national accounts cover heterogeneous goods and services, so statisticians use price indices, quantity indicators and other estimation methods rather than physically counting every product. The selection of suitable deflators is especially important for services, informal activities and rapidly changing products.
The base year supplies a reference price structure. Periodic rebasing updates the statistical framework to reflect changes in industries, consumption, technology and data availability. A sound base year should have reliable information and be reasonably representative. India’s national accounts series introduced in January 2015 used 2011–12 as its base year. Questions and data comparisons referring to this series should be interpreted within that framework; series with different bases should not be mechanically spliced.
The implicit GDP deflator is obtained by dividing nominal GDP by real GDP and multiplying by 100. Within a consistently constructed series, its base-year value is 100. Unlike the Consumer Price Index, it is not confined to a household consumption basket: it reflects prices associated with domestically produced final output, including investment goods, government output and exports. Imported goods are not directly part of domestic production, although imported inputs can influence domestic costs.
For comparable periods, the exact relationship is: 1 + nominal GDP growth = (1 + real GDP growth) × (1 + GDP deflator inflation), with rates expressed as decimals. Subtracting inflation from nominal growth is only an approximation. Moreover, the relevant inflation measure is GDP deflator inflation, not automatically CPI or WPI inflation.
- With 12% nominal growth and 5% deflator inflation, real growth is approximately 6.67%, calculated as (1.12 / 1.05 − 1) × 100.
- A base-year revision can alter historical estimates because it may introduce improved coverage, sources and methods, not merely different prices.
Reading a real GDP release
- 1. Identify the reference period, base year and release vintage.
- 2. Distinguish current-price estimates from constant-price estimates.
- 3. Check whether growth is annual, year-on-year quarterly or seasonally adjusted quarter-on-quarter.
- 4. Examine sectoral GVA and expenditure components.
- 5. Assess base effects, population growth and complementary welfare indicators.
3. Real GDP in Indian national accounts
India’s National Statistical Office, under the Ministry of Statistics and Programme Implementation, compiles national accounts. GDP is released at current and constant prices, through annual and quarterly estimates. The Indian financial year runs from April to March. Advance estimates necessarily use incomplete information; subsequent provisional and revised estimates incorporate more comprehensive administrative, corporate and survey data.
On the production side, sectoral gross value added measures output minus intermediate consumption. Agriculture, manufacturing, construction and services contribute to aggregate GVA. GDP at market prices is obtained by adding taxes on products and subtracting subsidies on products from GVA at basic prices. Consequently, GDP growth and GVA growth need not be identical, particularly when net product taxes change sharply.
On the expenditure side, GDP comprises private and government final consumption expenditure, gross capital formation, and exports minus imports. Gross capital formation includes fixed investment, changes in inventories and acquisitions less disposals of valuables. Published accounts may show statistical discrepancies because expenditure and production estimates draw on different sources. Imports are subtracted to remove foreign production already included in expenditure components, not because importing is inherently an economic loss.
- Use constant-price estimates to assess changes in production volume.
- Use current-price GDP for ratios such as fiscal deficit to GDP and public debt to GDP when the numerator is also measured in current rupees.
- Check the base year, financial year, release date and revision status before comparing GDP figures.
| Indicator | Meaning | Principal use or caution |
|---|---|---|
| Nominal GDP | Domestic production valued at current prices | Measures current monetary size; affected by inflation |
| Real GDP | Domestic production adjusted for price changes | Tracks changes in production volume |
| GDP deflator | Nominal GDP divided by real GDP, multiplied by 100 | Broad implicit price index for domestic output |
| Real GDP per capita | Real GDP divided by population | Average output indicator; conceals distribution |
| Real GVA | Value added measured at constant prices | Useful for analysing sectoral production |
4. Interpreting growth without common errors
Real GDP growth measures the percentage change in real GDP between two periods. A slowdown means that output is growing more slowly; a contraction means that output has fallen. If growth declines from 8% to 5%, the economy still expands. Negative growth is required for the measured output level to decline.
The base effect arises because a growth rate depends on the comparison-period level. If real GDP falls from 100 to 90 and then rises by 10%, it reaches only 99. A 10% contraction requires approximately 11.11% subsequent growth to recover fully. Strong growth after a disruption must therefore be assessed alongside the output level and the longer-term trend.
Quarterly year-on-year growth compares a quarter with the corresponding quarter of the previous year, reducing some seasonal distortions. Quarter-on-quarter growth compares adjacent quarters and generally requires seasonal adjustment for meaningful interpretation. Neither should be confused with annual financial-year growth. Similarly, two consecutive quarters of contraction is a commonly used technical shorthand for recession, not a universal definition capturing every economic downturn.
- Lower positive inflation is disinflation; falling prices constitute deflation.
- Real GDP may grow faster than nominal GDP when the GDP deflator falls.
- A rising real GDP level does not prove that the economy has recovered to its pre-shock trend.
5. Policy relevance and limitations
Real GDP helps governments and the Reserve Bank of India assess economic activity, demand conditions and the business cycle. It informs fiscal planning, monetary policy and investment decisions. Comparison with potential output can indicate spare productive capacity or overheating, although potential output is estimated rather than directly observed. Real GDP should be read alongside inflation, employment, capacity utilisation and sectoral indicators.
Real GDP per capita divides real GDP by population. If output grows more slowly than population, average real output per person declines despite aggregate expansion. Even rising per capita output says little about distribution: gains may be concentrated among particular regions, firms or income groups. Employment intensity also matters because output can rise through productivity improvements without proportionate job creation.
GDP is not a comprehensive welfare measure. It does not deduct environmental degradation or resource depletion, and most unpaid household services lie outside its production boundary. Market reconstruction after a disaster can raise measured output while losses of assets and well-being remain substantial. Cross-country comparisons additionally require attention to purchasing power parity rather than relying solely on exchange-rate conversions. A balanced assessment combines real GDP with health, education, inequality, employment and environmental indicators.
- Real GDP measures production, not the distribution of income or the sustainability of growth.
- GDP and national income are related but not interchangeable; national aggregates incorporate net primary income from the rest of the world.
Real GDP growth: interpreting projections and comparisons
Real GDP growth measures the change in domestic output after removing the effect of price changes. The supplied metadata describes OECD growth projections for 2012–2040 under the IEO2016 Reference case. It therefore offers a comparative example of real GDP growth, not evidence about India or a record of realised growth throughout that period. A projected average annual rate summarises a long horizon; it does not imply that output grows at that rate every year.
For India, real GDP at constant prices helps distinguish expansion in production from increases in its monetary value caused by inflation. Nominal GDP can rise even when real output is unchanged. Purchasing power parity, mentioned in the metadata, addresses differences in price levels across economies; it is conceptually distinct from removing price changes over time. The projection description also links growth to labour-force changes and productivity, illustrating why long-term estimates depend on assumptions rather than representing certain outcomes.
- Real versus nominal: with consistent coverage, the GDP deflator equals nominal GDP divided by real GDP, multiplied by 100. It is not interchangeable with consumer price inflation.
- GDP versus GVA: GDP at market prices equals GVA at basic prices plus taxes on products minus subsidies on products. Real growth comparisons require consistent price bases.
- Growth versus welfare: aggregate real GDP growth need not imply rising real GDP per person if population grows faster. Neither measure alone establishes equitable distribution or environmental sustainability.
Real-world case studies
India’s pandemic contraction and recovery
COVID-19 restrictions caused a sharp contraction in Indian real GDP in 2020–21, followed by a rebound in 2021–22. The unusually low comparison base amplified subsequent growth rates. The episode illustrates why recovery should be evaluated through output levels, sectoral performance and employment, rather than headline growth alone.
India’s 2015 national accounts revision
The January 2015 revision changed the base year from 2004–05 to 2011–12 and introduced methodological and data improvements, including wider use of the Ministry of Corporate Affairs’ MCA21 database. It demonstrated that rebasing can improve the representation of economic activity, rather than simply rescale an unchanged series.
Previous year questions
No source-linked PYQ is available here yet. Use the practice questions below.
Practice questions
Practice MCQ 1
An economy’s nominal GDP rises by 10%, while its GDP deflator rises by 10% over the same period. Its real GDP:
- A. Increases by 10%
- B. Remains unchanged
- C. Falls by 10%
- D. Increases by 20%
Practice MCQ 2
Consider the following statements: 1. Real GDP deducts depreciation from nominal GDP. 2. The GDP deflator and CPI necessarily have identical coverage. 3. Real GDP can increase even when real GDP per capita declines. Which of the statements is/are correct?
- A. 1 only
- B. 1 and 2 only
- C. 3 only
- D. 2 and 3 only
Practice MCQ 3
An economy’s real GDP falls from 200 units to 180 units and then increases to 198 units. Which statement is correct?
- A. Output has fully recovered because the decline and subsequent growth were both 10%
- B. Output is 1% below its original level despite 10% growth in the recovery period
- C. Recovery-period growth is 9%
- D. The initial contraction was 20%
Mains practice · Real GDP growth is necessary for assessing economic performance but insufficient for assessing development. Discuss with reference to India. (150 words)
- Define real GDP and its advantage over nominal GDP for measuring production growth.
- Explain its relevance to macroeconomic policy and sectoral analysis.
- Distinguish aggregate growth from per capita growth and equitable distribution.
- Discuss employment, unpaid care work and environmental costs.
- Use the pandemic recovery to illustrate base effects.
- Conclude with complementary social, labour-market and sustainability indicators.
Further reading
- NCERT, Introductory Macroeconomics, Class XII: National Income Accounting.
- Ministry of Statistics and Programme Implementation: National Accounts Statistics and GDP press releases, mospi.gov.in.
- MoSPI: Changes in Methodology and Data Sources in the New Series of National Accounts, Base Year 2011–12.
- Government of India, Economic Survey: State of the Economy and Statistical Appendix.
- United Nations and partner institutions, System of National Accounts 2008.
- https://commons.wikimedia.org/wiki/File:OECD_real_gross_domestic_product_growth_rates,_2012-40_(29155427165).png
Preparing for UPSC Civil Services? Get classroom teaching, answer-writing evaluation and mentorship at Pragnya IAS Academy, Ashok Nagar — see why aspirants choose us for IAS coaching in Hyderabad.