New UPSC Foundation, Optional and TGPSC/APPSC batches are open — book your counselling slot.Today's Current AffairsToday's Daily QuizPlaces in NewsCall 98804 87071

Topic-wise PYQs · Prelims CSAT (General Studies Paper II)

Data Interpretation — UPSC Prelims CSAT (GS II) PYQs (2017–2026)

24 questions across ten years. Use the year bars or sub-topics to narrow the list.

Questions per year

Showing 24 of 24

Q682025 · CSAT (GS II)Data Interpretation · Data Sufficiency Factors

A question is given followed by two Statements I and II. Consider the Question and the Statements and mark the correct option.

Question:

What is the smallest 1-digit number having exactly 4 distinct factors?

Statement I: 2 is one of the factors.

Statement II: 3 is one of the factors.

Which one of the following is correct in respect of the above Question and the Statements?

  1. AThe Question can be answered by using one of the Statements alone, but cannot be answered using the other statement alone.
  2. BThe Question can be answered by using either Statement alone.
  3. CThe Question can be answered by using both the Statements together, but cannot be answered using either Statement alone.
  4. DThe Question can be answered even without using any of the Statements.
Study CSAT
Q692025 · CSAT (GS II)Data Interpretation · Data Sufficiency Cryptarithm

A question is given followed by two Statements I and II. Consider the Question and the Statements and mark the correct option.

Question:

Let P, Q, R, S be distinct non-zero digits. If PP × PQ = RRSS, where P ≤ 3 and Q ≤ 4, then what is Q equal to?

Statement I: R = 1.

Statement II: S = 2.

Which one of the following is correct in respect of the above Question and the Statements?

  1. AThe Question can be answered by using one of the Statements alone, but cannot be answered using the other statement alone.
  2. BThe Question can be answered by using either Statement alone.
  3. CThe Question can be answered by using both the Statements together, but cannot be answered using either Statement alone.
  4. DThe Question can be answered even without using any of the Statements.
Study CSAT
Q702025 · CSAT (GS II)Data Interpretation · Data Sufficiency Relations

A question is given followed by two Statements I and II. Consider the Question and the Statements and mark the correct option.

Question:

How is Q related to P?

Statement I: P has two sisters, R and S.

Statement II: R's father is the brother of Q.

Which one of the following is correct in respect of the above Question and the Statements?

  1. AThe Question can be answered by using one of the Statements alone, but cannot be answered using the other statement alone.
  2. BThe Question can be answered by using either Statement alone.
  3. CThe Question can be answered by using both the Statements together, but cannot be answered using either Statement alone.
  4. DThe Question cannot be answered even using any of the Statements.
Study CSAT
Q732025 · CSAT (GS II)Data Interpretation · Data Sufficiency Sports

A question is given followed by two Statements I and II. Consider the Question and the Statements and mark the correct option.

Question:

In a football match, team P playing against Q was behind by 3 goals with 10 minutes remaining. Does team P win the match?

Statement I: Team P scored 4 goals in the last 10 minutes.

Statement II: Team Q scored a total of 4 goals in the match.

Which one of the following is correct in respect of the above Question and the Statements?

  1. AThe Question can be answered by using one of the Statements alone, but cannot be answered using the other statement alone.
  2. BThe Question can be answered by using either Statement alone.
  3. CThe Question can be answered by using both the Statements together, but cannot be answered using either Statement alone.
  4. DThe Question cannot be answered even using any of the Statements.
Study CSAT
Q742025 · CSAT (GS II)Data Interpretation · Data Sufficiency Algebra

A question is given followed by two Statements I and II. Consider the Question and the Statements and mark the correct option.

Question:

Is (p + q)² – 4 pq, where p, q are natural numbers, positive?

Statement I: p < q.

Statement II: p > q.

Which one of the following is correct in respect of the above Question and the Statements?

  1. AThe Question can be answered by using one of the Statements alone, but cannot be answered using the other statement alone.
  2. BThe Question can be answered by using either Statement alone.
  3. CThe Question can be answered by using both the Statements together, but cannot be answered using either Statement alone.
  4. DThe Question cannot be answered even without using any of the Statements.
Study CSAT
Q702022 · CSAT (GS II)Data Interpretation · Pie Charts

A pie chart gives the expenditure on five different items A, B, C, D and E in a household. If B, C, D and E correspond to 90°, 50°, 45° and 75° respectively, then what is the percentage of expenditure on item A?

  1. A112/9
  2. B125/6
  3. C155/9
  4. D250/9
Study CSAT
Q452021 · CSAT (GS II)Data Interpretation · Table Analysis

Consider the following Table:

Player — Runs scored in the First Innings — Balls faced in the First Innings — Runs scored in the Second Innings — Balls faced in the Second Innings

A — 61 — 99 — 14 — 76

B — 05 — 12 — 50 — 85

C — 15 — 75 — 20 — 50

D — 13 — 55 — 12 — 50

Who is the fastest run scorer in the Test Match?

  1. AA
  2. BB
  3. CC
  4. DD
Study CSAT
Q742021 · CSAT (GS II)Data Interpretation · Pie Chart analysis

A pie diagram shows the percentage distribution of proteins, water and other dry elements in the human body. Given that proteins correspond to 16% and water corresponds to 70%. If both proteins and the other dry elements correspond to p%, then what is the central angle of the sector representing p on the pie diagram?

  1. A54°
  2. B96°
  3. C108°
  4. D120°
Study CSAT
Q522020 · CSAT (GS II)Data Interpretation · Demography Analysis

Consider the following data:

Year — Birthrate — Death rate

1911-1921 — 48.1 — 35.5

1921-1931 — 46.4 — 36.3

1931-1941 — 45.2 — 31.2

1941-1951 — 39.9 — 27.4

1951-1961 — 41.7 — 22.8

1961-1971 — 41.1 — 18.9

1971-1981 — 37.1 — 14.8

For which period was the natural growth rate maximum?

  1. A1911-1921
  2. B1941-1951
  3. C1961-1971
  4. D1971-1981
Study CSAT
Q52018 · CSAT (GS II)Data Interpretation · Graph Analysis

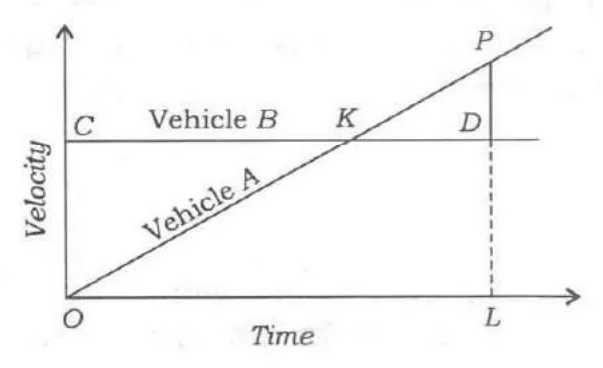
The figure drawn below gives the velocity graphs of two vehicles A and B. The straight line OKP represents the velocity of vehicle A at any instant, whereas the horizontal straight line CKD represents the velocity of vehicle B at any instant. In the figure, D is the point where perpendicular from P meets the horizontal line CKD such that PD = 1/2 LD:

What is the ratio between the distances covered by vehicles A and B in the time interval OL?

Figure for UPSC Prelims 2018 CSAT (GS II) question 5
Figure reproduced from the official UPSC question paper.
  1. A1: 2
  2. B2: 3
  3. C3: 4
  4. D1: 1
Study CSAT
Q112018 · CSAT (GS II)Data Interpretation · Bar Chart

Directions for the following 3 (three) items:

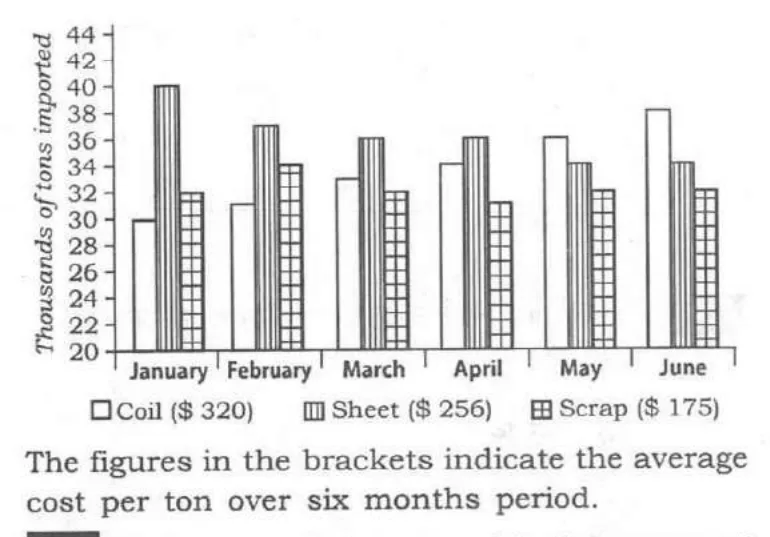
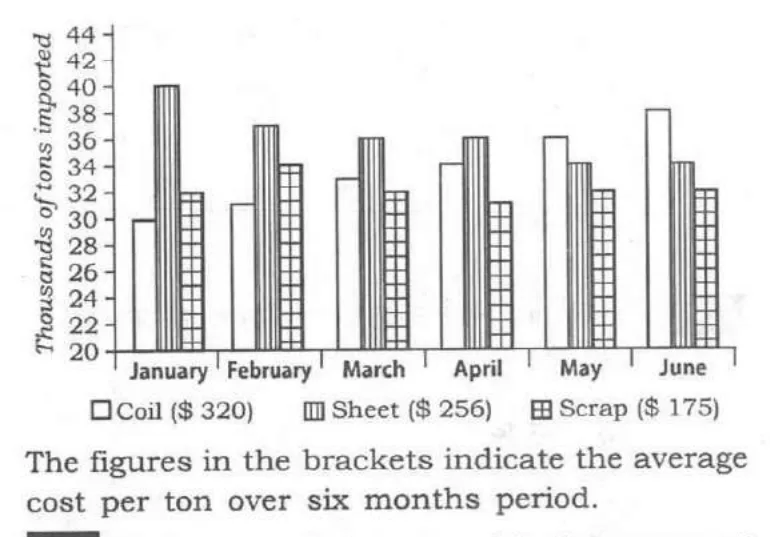
The following three items are based on the graph given below which shows imports of three different types of steel over a period of six months of a year. Study the graph and answer the three items that follow.

[Bar Graph]

The figures in the brackets indicate the average cost per ton over six months period.

11. By how much (measured in thousands of tons) did the import of sheet steel exceed the import of coil steel in the first three months of the year?

Figure for UPSC Prelims 2018 CSAT (GS II) question 11
Figure reproduced from the official UPSC question paper.
  1. A11
  2. B15
  3. C19
  4. D23
Study CSAT
Q122018 · CSAT (GS II)Data Interpretation · Bar Chart

Directions for the following 3 (three) items:

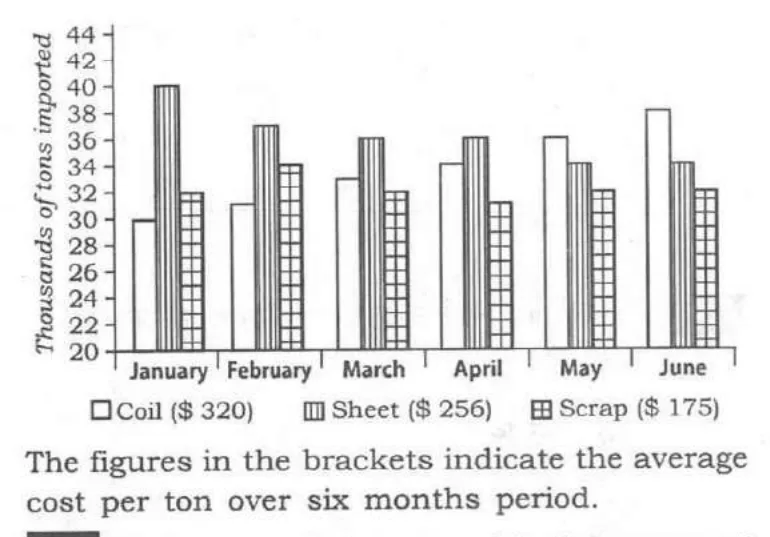
The following three items are based on the graph given below which shows imports of three different types of steel over a period of six months of a year. Study the graph and answer the three items that follow.

[Bar Graph]

The figures in the brackets indicate the average cost per ton over six months period.

12. What was the approximate total value (in $) of sheet steel imported over the six months period?

Figure for UPSC Prelims 2018 CSAT (GS II) question 12
Figure reproduced from the official UPSC question paper.
  1. A45,555
  2. B50,555
  3. C55,550
  4. D65,750
Study CSAT
Q132018 · CSAT (GS II)Data Interpretation · Bar Chart

Directions for the following 3 (three) items:

The following three items are based on the graph given below which shows imports of three different types of steel over a period of six months of a year. Study the graph and answer the three items that follow.

[Bar Graph]

The figures in the brackets indicate the average cost per ton over six months period.

13. What was the approximate ratio of sheet steel and scrap steel imports in the first three months of the year?

Figure for UPSC Prelims 2018 CSAT (GS II) question 13
Figure reproduced from the official UPSC question paper.
  1. A1: 1
  2. B1.2: 1
  3. C1.4: 1
  4. D1.6: 1
Study CSAT
Q612018 · CSAT (GS II)Data Interpretation · Line Graph

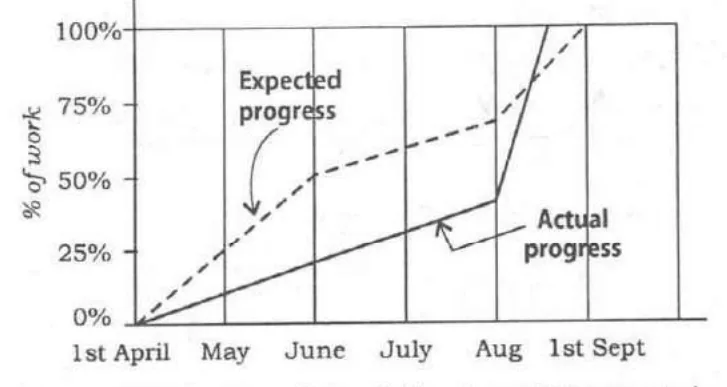
Consider the following graph:

Which one of the following statements is not correct with reference to the graph given above?

Figure for UPSC Prelims 2018 CSAT (GS II) question 61
Figure reproduced from the official UPSC question paper.
  1. AOn 1st June, the actual progress of work was less than expected.
  2. BThe actual rate of progress of work was the greatest during the month of August.
  3. CThe work was actually completed before the expected time.
  4. DDuring the period from 1st April to 1st September, at no time was the actual progress more than the expected progress.
Study CSAT
Q632018 · CSAT (GS II)Data Interpretation · Graph Analysis

Directions for the following 2 (two) items:

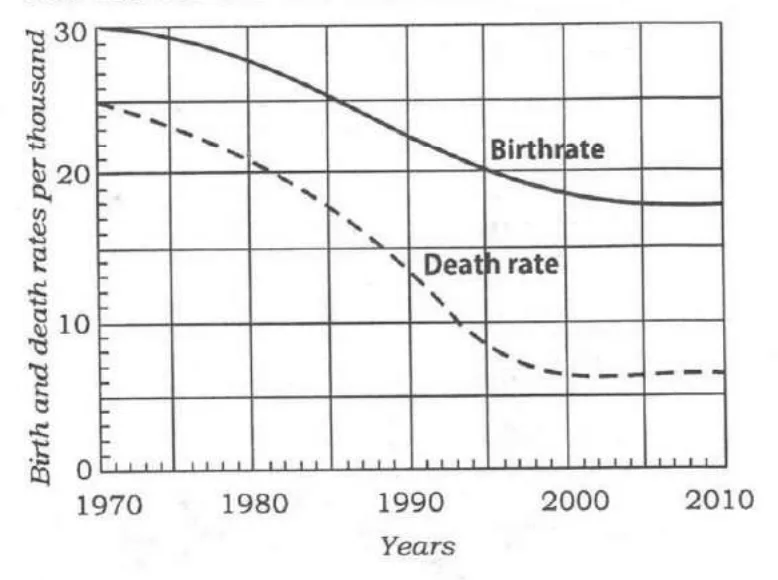
Consider the following graph in which the birthrate and death rate of a country are given, and answer the two items that follow.

Looking at the graph, it can be inferred that from 1990 to 2010

Figure for UPSC Prelims 2018 CSAT (GS II) question 63
Figure reproduced from the official UPSC question paper.
  1. Apopulation growth rate has increased
  2. Bpopulation growth rate has decreased
  3. Cgrowth rate of population has remained stable
  4. Dpopulation growth rate shows no trend
Study CSAT
Q642018 · CSAT (GS II)Data Interpretation · Graph Analysis

Directions for the following 2 (two) items:

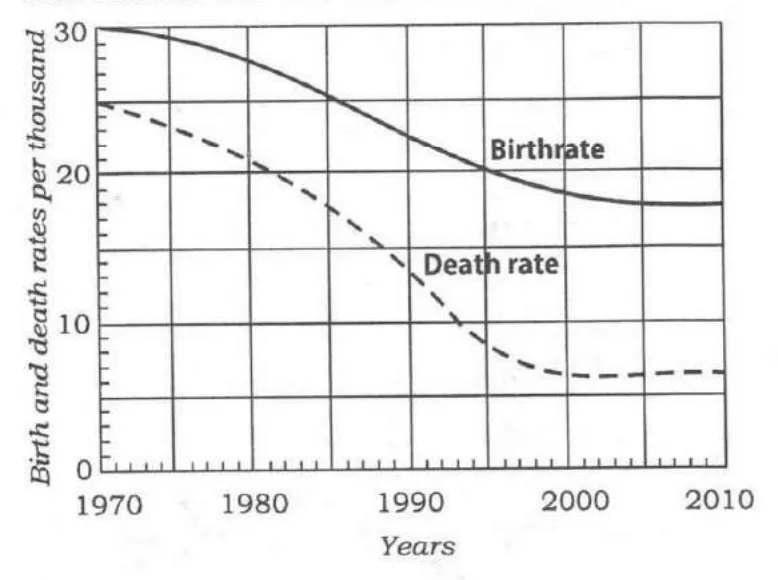
Consider the following graph in which the birthrate and death rate of a country are given, and answer the two items that follow.

With reference to the above graph, consider the following statements considering 1970 as base year:

1. Population has stabilized after 35 years.

2. Population growth rate has stabilized after 35 years.

3. Death rate has fallen by 10% in the first 10 years.

4. Birthrate has stabilized after 35 years.

Which of the above are the most logical and rational statements that can be made from the above graph?

Figure for UPSC Prelims 2018 CSAT (GS II) question 64
Figure reproduced from the official UPSC question paper.
  1. A1 and 2 only
  2. B1, 2 and 3
  3. C3 and 4
  4. D2 and 4
Study CSAT
Q652018 · CSAT (GS II)Data Interpretation · Graph Analysis

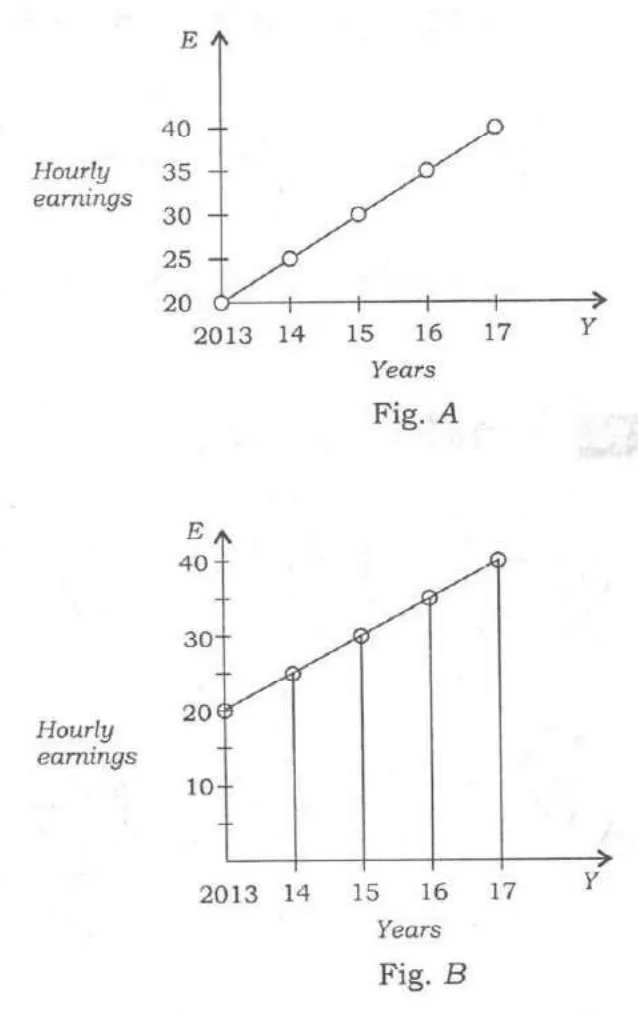
Average hourly earnings per year (E) of the workers in a firm are represented in figures A and B as follows:

From the figures, it is observed that the

Figure for UPSC Prelims 2018 CSAT (GS II) question 65
Figure reproduced from the official UPSC question paper.
  1. Avalues of E are different
  2. Branges (i.e., the difference between the maximum and the minimum) of E are different
  3. Cslopes of the graphs are same
  4. Drates of increase of E are different
Study CSAT
Q672018 · CSAT (GS II)Data Interpretation · Graph Analysis

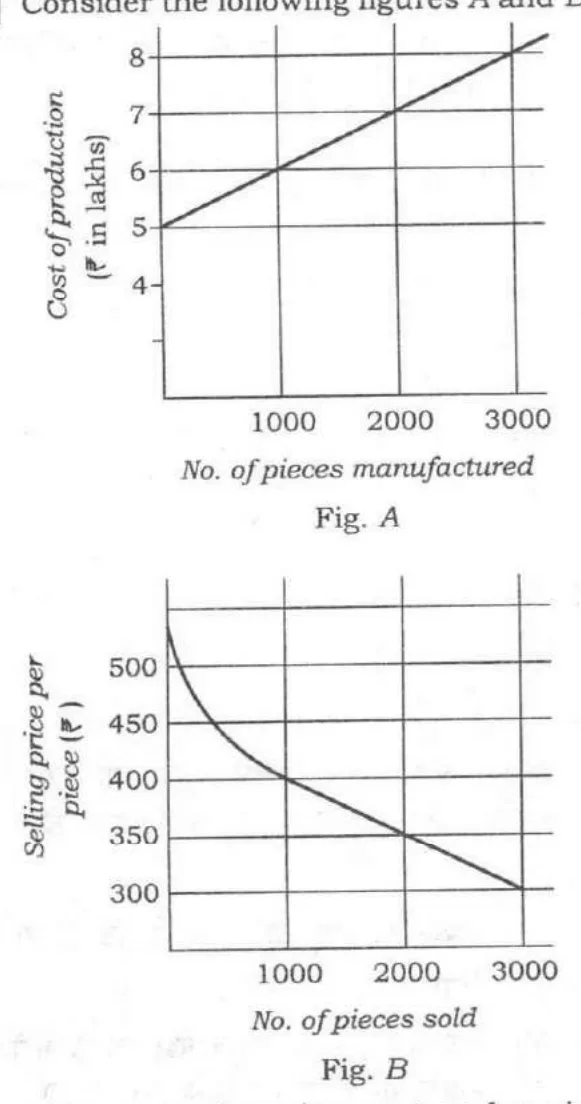
Consider the following figures A and B:

The manufacturing cost and projected sales for a product are shown in the above figures A and B respectively. What is the minimum number of pieces that should be manufactured to avoid a loss?

Figure for UPSC Prelims 2018 CSAT (GS II) question 67
Figure reproduced from the official UPSC question paper.
  1. A2000
  2. B2500
  3. C3000
  4. D3500
Study CSAT
Q712018 · CSAT (GS II)Data Interpretation · Graph Analysis

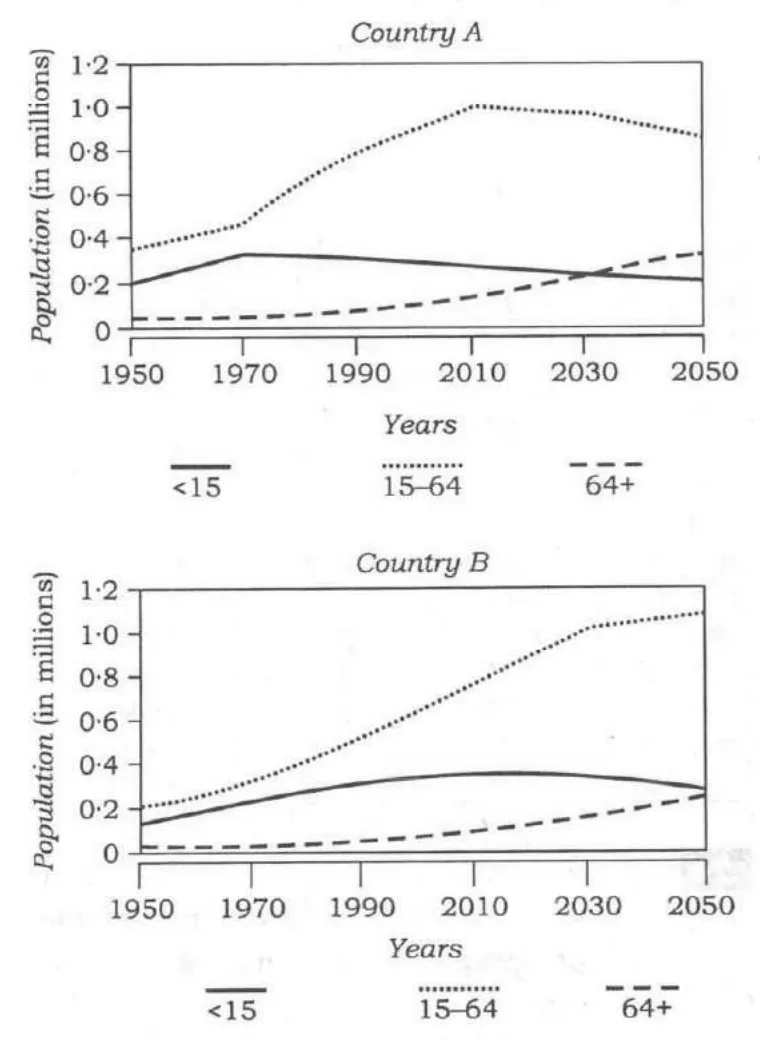
Consider the following graphs. The curves in the graphs indicate different age groups in the populations of two countries A and B over a period of few decades:

With reference to the above graphs, which of the following are the most logical and rational inferences that can be made?

1. Over the last two and a half decades, the dependency ratio for country B has decreased.

2. By the end of next two and a half decades, the dependency ratio of country A will be much less than that of country B.

3. In the next two decades, the work force relative to its total population will increase in country B as compared to country A.

Figure for UPSC Prelims 2018 CSAT (GS II) question 71
Figure reproduced from the official UPSC question paper.
  1. A1 and 2 only
  2. B2 and 3 only
  3. C1 and 3 only
  4. D1, 2 and 3
Study CSAT
Q732018 · CSAT (GS II)Data Interpretation · Graph Analysis

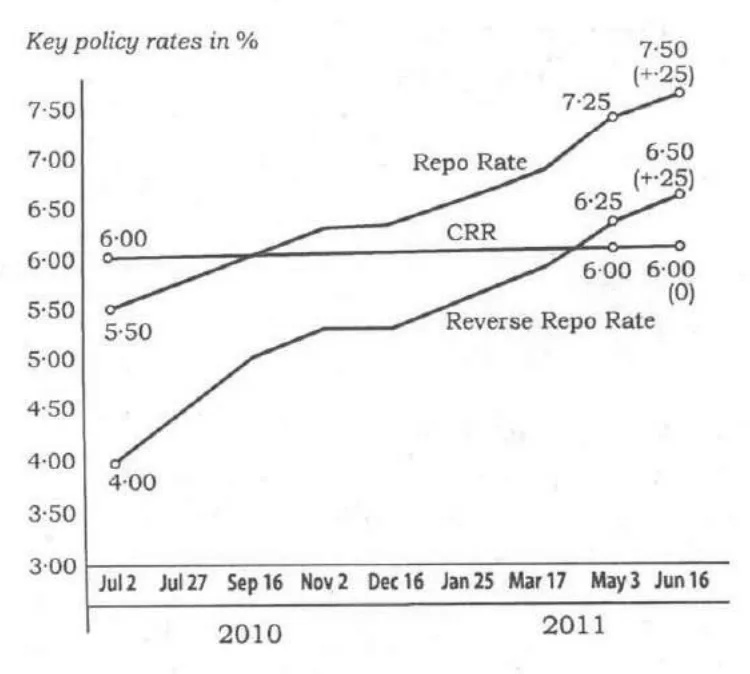
The graph given below indicates the changes in key policy rates made by the Central Bank several times in a year:

Which one of the following can be the most likely reason for the Central Bank for such an action?

Figure for UPSC Prelims 2018 CSAT (GS II) question 73
Figure reproduced from the official UPSC question paper.
  1. AEncouraging foreign investment
  2. BIncreasing the liquidity
  3. CEncouraging both public and private savings
  4. DAnti-inflationary stance
Study CSAT
Q742018 · CSAT (GS II)Data Interpretation · Table Analysis

Directions for the following 2 (two) items:

The following table gives the GDP growth rate and Tele-density data of different States of a country in a particular year. Study the table and answer the two items that follow.

States — Per capita income ($) — GDP growth rate (%) — Tele-density

State 1 — 704 — 9.52 — 70.27

State 2 — 419 — 5.31 — 35.88

State 3 — 254 — 10.83 — 50.07

State 4 — 545 — 9.78 — 5.94

State 5 — 891 — 10.8 — 76.12

State 6 — 1077 — 11.69 — 77.5

State 7 — 900 — 8.88 — 104.86

State 8 — 395 — 5.92 — 6

State 9 — 720 — 7.76 — 82.25

State 10 — 893 — 9.55 — 96.7

State 11 — 363 — 4.7 — 57.7

State 12 — 966 — 7.85 — 63.8

State 13 — 495 — 9.37 — 52.3

State 14 — 864 — 5.46 — 97.9

State 15 — 497 — 7.48 — 62.3

State 16 — 777 — 7.03 — 93.8

State 17 — 335 — 5.8 — 49.9

State 18 — 599 — 7.49 — 47.84

With reference to the above table, which of the following is/are the most logical and rational inference/inferences that can be made?

1. Higher per capita income is generally associated with higher Tele-density.

2. Higher GDP growth rate always ensures higher per capita income.

3. Higher GDP growth rate does not necessarily ensure higher Tele-density.

Select the correct answer using the code given below.

  1. A1 only
  2. B2 and 3
  3. C1 and 3
  4. D3 only
Study CSAT
Q752018 · CSAT (GS II)Data Interpretation · Table Analysis

With reference to the above table, the following assumptions have been made:

1. Nowadays, prosperity of an already high performing State cannot be sustained without making further large investments in its telecom infrastructure.

2. Nowadays, a very high Tele-density is the most essential condition for promoting the business and economic growth in a State.

Which of the above assumptions is/are valid?

  1. A1 only
  2. B2 only
  3. CBoth 1 and 2
  4. DNeither 1 nor 2
Study CSAT
Q762018 · CSAT (GS II)Data Interpretation · Graph Analysis

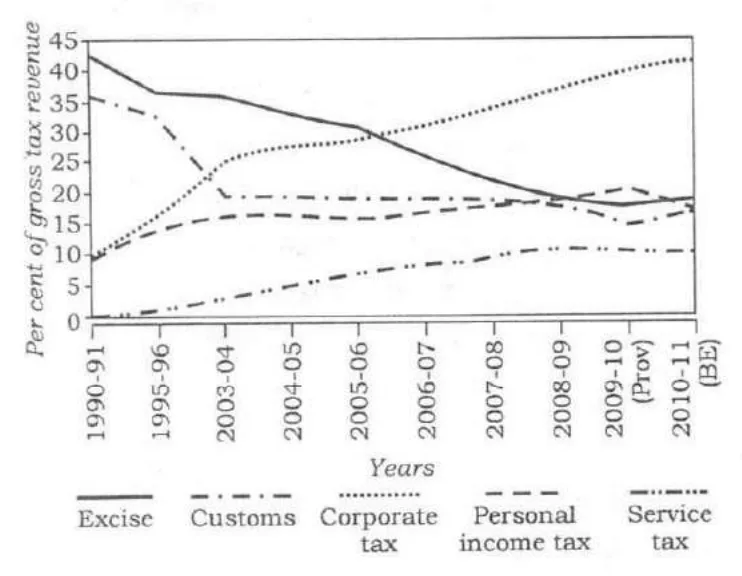
The following graph indicates the composition of our tax revenue for a period of two decades:

With reference to the above graph, which of the following is/are the most logical and rational inference/inferences that can be made?

1. During the given period, the revenue from Direct Taxes as percentage of gross tax revenue has increased while that of Indirect Taxes decreased.

2. The trend in the revenue from Excise Duty demonstrates that the growth of manufacturing sector has been negative during the given period.

Select the correct answer using the code given below.

Figure for UPSC Prelims 2018 CSAT (GS II) question 76
Figure reproduced from the official UPSC question paper.
  1. A1 only
  2. B2 only
  3. CBoth 1 and 2
  4. DNeither 1 nor 2
Study CSAT

Free UPSC daily current affairs quiz — 10 questions, new every day at 8 am IST.

Call nowWhatsApp