
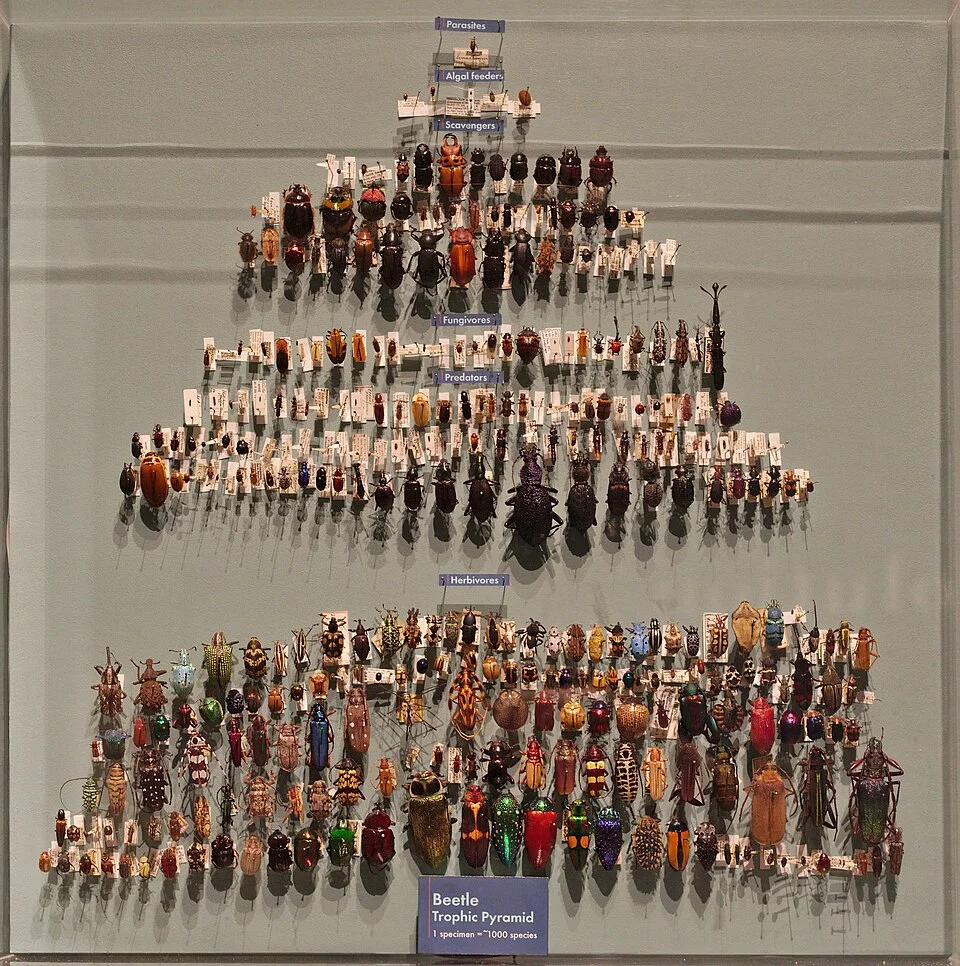
Beetle trophic pyramid exhibit at the Harvard Museum of Natural History; an illustrative museum example.
Credit: Balise42 · CC BY-SA 4.0 · sourceResized and converted to WebP; uncropped.
1. Concept and construction
An ecological pyramid is a diagram in which the width of each horizontal bar represents a measurable quantity at a trophic level. In a conventional grazing food chain, producers occupy the base, herbivores form the next level, and carnivores occupy successively higher levels. The vertical position indicates the feeding level; it does not indicate evolutionary advancement, organism size or ecological importance. The width may represent abundance, biomass or energy flow, so the variable and its units must be identified before interpreting the diagram.
The term pyramid does not guarantee a triangular, upright shape. Ecological communities contain organisms with very different body sizes, life spans and turnover rates. A few large producers can support numerous small consumers, while a small standing stock of rapidly reproducing producers can sustain a larger consumer biomass. These relationships explain why some diagrams narrow, widen or alternate in width as trophic levels increase.
A meaningful comparison requires a clearly defined ecosystem, sampling boundary and measurement period. Counts from different areas cannot be compared directly, nor should biomass measured in different seasons be treated as simultaneous stocks. Energy comparisons particularly require a common time interval. Ecological pyramids simplify community organisation; they are useful analytical models rather than complete descriptions of every feeding relationship.
- Typical grazing sequence: grass → grasshopper → frog → snake.
- Read the diagram in this order: variable, units, trophic levels, shape and ecological explanation.
2. Pyramid of numbers
A pyramid of numbers shows the abundance of organisms at successive trophic levels, usually within a defined area. It treats each counted organism as one unit, regardless of size. Grassland food chains commonly produce an upright pattern: numerous grass plants support fewer herbivores, which support still fewer predators. This is a typical relationship, not a rule applying to every grassland community or every sampling method.
A tree-centred food chain illustrates why the pyramid can have a narrow producer base. One large tree may support many herbivorous insects, while those insects support fewer insectivorous birds. The resulting diagram can be spindle-shaped rather than uniformly inverted. In a host–parasite–hyperparasite chain, one or a few hosts may support many parasites, and the parasites may support even more hyperparasites, producing an inverted numerical relationship.
Numbers alone can therefore misrepresent the amount of living material supporting a food chain. One tree and one grass plant count equally, despite enormous differences in mass and production. Counting individuals also becomes difficult in clonal grasses, colonial organisms and microorganisms. Questions stating that a forest pyramid is always inverted should be approached cautiously: its form depends on the organisms and feeding pathway selected.
- Advantage: relatively simple for clearly identifiable, countable organisms.
- Limitation: ignores differences in body size and does not directly measure energy availability.
Why an aquatic biomass pyramid can be inverted
- 1. Phytoplankton capture energy and grow rapidly.
- 2. Grazing removes much of their newly produced biomass.
- 3. Rapid reproduction replenishes a small standing producer stock.
- 4. Longer-lived consumers maintain a larger standing biomass.
- 5. Energy flow still decreases toward higher trophic levels.
3. Pyramid of biomass: stock versus production
A biomass pyramid represents the standing mass of living organisms at each trophic level at a particular time. Dry mass, commonly expressed as grams per square metre, is generally preferable to fresh mass because water content differs among organisms. Aquatic measurements may use a defined water volume or an integrated water column. Biomass is a stock; productivity is the rate at which new biomass or stored chemical energy is generated.
In many terrestrial ecosystems, producer biomass greatly exceeds herbivore biomass, which exceeds carnivore biomass. Trees accumulate large quantities of wood over many years, producing a broad basal bar. Grasslands also commonly exhibit upright biomass pyramids. However, the measured pattern can vary with season, grazing pressure, disturbance and the boundaries used to define the community.
Some plankton-based aquatic ecosystems exhibit an inverted producer–consumer biomass relationship. Phytoplankton may have less standing biomass than the zooplankton they support because phytoplankton reproduce rapidly and are consumed rapidly. Their small stock is repeatedly renewed. Longer-lived consumers can consequently maintain a larger standing biomass without receiving more energy than producers supply over time.
The explanation is a high production-to-biomass ratio and short turnover time among producers. An inverted biomass pyramid does not imply inverted energy flow or unusually efficient transfer. Nor does it establish that every aquatic biomass pyramid must be inverted. Lakes, oceans, macrophyte-dominated waters and seasonally changing plankton communities may show different patterns.
- Standing biomass: mass present at a particular instant.
- Productivity: new biomass or energy accumulated per unit area per unit time.
- Exam trap: low standing phytoplankton biomass need not mean low primary productivity.
| Type | Quantity and typical units | Possible shape | Main caution |
|---|---|---|---|
| Numbers | Individuals per defined area | Upright, inverted or spindle-shaped | Individual size is ignored |
| Biomass | Dry mass, such as g/m² | Upright or inverted | Standing stock is not productivity |
| Energy | Energy flow, such as kJ/m²/year | Always upright | Use consistent spatial and temporal boundaries |
4. Pyramid of energy and trophic transfer
An energy pyramid represents energy flow through successive trophic levels, commonly in kilojoules per square metre per year. With consistent accounting, it is always upright. Organisms use assimilated energy for respiration and maintenance, and much of this energy is ultimately dissipated as heat. Other energy remains in uneaten tissues, faeces and dead organic matter, entering detrital pathways rather than passing directly to the next consumer level.
The first law of thermodynamics concerns conservation of energy; the second explains why transformations dissipate usable energy and require continuing energy input. Most ecosystems depend ultimately on solar energy captured by photosynthesis. Energy moves through ecosystems and is dissipated, whereas nutrients circulate through biogeochemical cycles. Decomposers recycle mineral nutrients but do not recycle dissipated heat into food-chain energy.
Gross primary productivity is total energy fixed by producers. Net primary productivity equals gross primary productivity minus producer respiration and represents new producer biomass available for consumption or entry into detrital pathways. Ecological or trophic transfer efficiency compares production at successive trophic levels. The familiar 10 per cent rule offers an approximate calculation: 10,000 units of producer production would yield about 1,000 units at the next level if transfer efficiency were exactly 10 per cent. Actual efficiencies vary substantially.
Declining energy availability helps explain why food chains usually contain relatively few trophic levels. It also constrains the production and abundance of higher consumers. However, the rule does not mean that exactly 90 per cent is immediately lost as heat at each feeding event; unconsumed and unassimilated material can support detrital food webs.
5. Limitations and examination applications
Simple pyramids usually represent a linear food chain rather than an interconnected food web. Omnivores may feed at more than one trophic level, and an organism's position may change with age or diet. Assigning every species permanently to one level therefore conceals important ecological relationships. Standard diagrams also usually omit the separate representation of decomposers and detritivores, even though these organisms process material originating from every trophic level.
Pyramids do not directly describe species richness, ecosystem stability, nutrient recycling or pollutant concentration. Biomagnification is a different phenomenon: certain persistent contaminants increase in concentration toward higher trophic levels even while available energy declines. Likewise, an inverted biomass pyramid does not demonstrate ecosystem degradation. Interpretation must account for turnover, seasonal sampling and external subsidies such as organic matter entering a stream from surrounding forests.
- Always upright: energy flow measured on a common area-and-time basis.
- Potentially inverted: organism numbers and standing biomass.
- Never infer productivity solely from a single measurement of biomass.
Reading Ecological Pyramids Correctly
The metadata identifies a beetle trophic pyramid exhibit, making it relevant to trophic organisation. An ecological pyramid compares successive feeding levels using a defined quantity: organism numbers, standing biomass or energy flow. The title alone does not establish which quantity this exhibit represents, so its shape should not be used to infer a particular ecological rule. This overseas museum example is illustrative, not field evidence from an Indian ecosystem.
The key distinction is between a stock and a flow. Biomass records living material present at a particular time, whereas energy flow measures energy transferred over an interval. In aquatic systems, rapidly reproducing phytoplankton can support a larger standing biomass of consumers despite having a smaller biomass at a given moment. This does not invert the energy pyramid: energy available to successive trophic levels declines through respiration and other losses. Indian ponds, forests and grasslands can be analysed using these principles, but their actual pyramid shapes require measurements.
- Numbers: Count individuals, not their size. A few large trees may support many herbivorous insects, producing an inverted producer–herbivore relationship.
- Biomass: Compare equivalent areas or volumes using consistent mass measures. An inverted standing-stock pyramid does not imply greater consumer productivity.
- Energy: Compare the same area and time interval. The energy pyramid remains upright; the familiar 10% transfer rule is an approximation, not a universal constant.
Real-world case studies
English Channel plankton
Classic studies by W. R. G. Atkins and H. W. Harvey and colleagues of English Channel plankton helped establish the importance of seasonal production and grazing. Marine plankton communities illustrate why a single biomass sample cannot reveal annual producer output: rapid phytoplankton renewal can sustain consumers despite a small standing stock.
Silver Springs, Florida
Howard T. Odum's 1957 study of Silver Springs quantified energy flow in a spring ecosystem. It became a classic demonstration of ecosystem energy budgeting, linking primary production, consumer production and respiration rather than relying only on organism counts.
Previous year questions
No source-linked PYQ is available here yet. Use the practice questions below.
Practice questions
Practice MCQ 1
A lake has lower phytoplankton standing biomass than zooplankton standing biomass. Which explanation is most appropriate?
- A. Energy transfer exceeds 100 per cent.
- B. Phytoplankton biomass is rapidly renewed through production.
- C. Zooplankton are necessarily primary producers.
- D. The lake violates the second law of thermodynamics.
Practice MCQ 2
Consider these statements: 1. A pyramid of numbers accounts for differences in body size. 2. An energy pyramid uses a time dimension. 3. Decomposers process organic material from several trophic levels. Which are correct?
- A. 1 and 2 only
- B. 2 and 3 only
- C. 1 and 3 only
- D. 1, 2 and 3
Practice MCQ 3
Producer net production is 20,000 kJ/m²/year. Assuming exactly 10 per cent transfer at each step, what is secondary-consumer production?
- A. 20 kJ/m²/year
- B. 200 kJ/m²/year
- C. 2,000 kJ/m²/year
- D. 18,000 kJ/m²/year
Mains practice · Explain why ecological pyramids may differ in shape. Why does an inverted biomass pyramid not contradict an upright energy pyramid? Answer in 150 words.
- Define numbers, biomass and energy pyramids.
- Use tree-associated insects to explain numerical variation.
- Contrast terrestrial biomass accumulation with rapid phytoplankton turnover.
- Distinguish standing stock from production rate.
- Explain respiratory dissipation and declining trophic energy flow.
- Mention food-web complexity and decomposer omission.
Further reading
- NCERT, Biology, Class XII, chapter Ecosystem.
- Eugene P. Odum and Gary W. Barrett, Fundamentals of Ecology.
- Charles Elton, Animal Ecology, 1927.
- Howard T. Odum, Trophic Structure and Productivity of Silver Springs, Florida, Ecological Monographs, 1957.
- https://commons.wikimedia.org/wiki/File:Beetle_trophic_pyramid.jpg
Preparing for UPSC Civil Services? Get classroom teaching, answer-writing evaluation and mentorship at Pragnya IAS Academy, Ashok Nagar — see why aspirants choose us for IAS coaching in Hyderabad.