

w:Sea otter in a kelp forest in sanctuary waters.
Credit: Robert Schwemmer/NOAA · Public domain · source

Vultures in the nest (Gyps indicus), on the tower of the Chaturbhuj Temple, Orchha, Madhya Pradesh, India.
Credit: Yann (talk) · CC BY-SA 4.0 · source
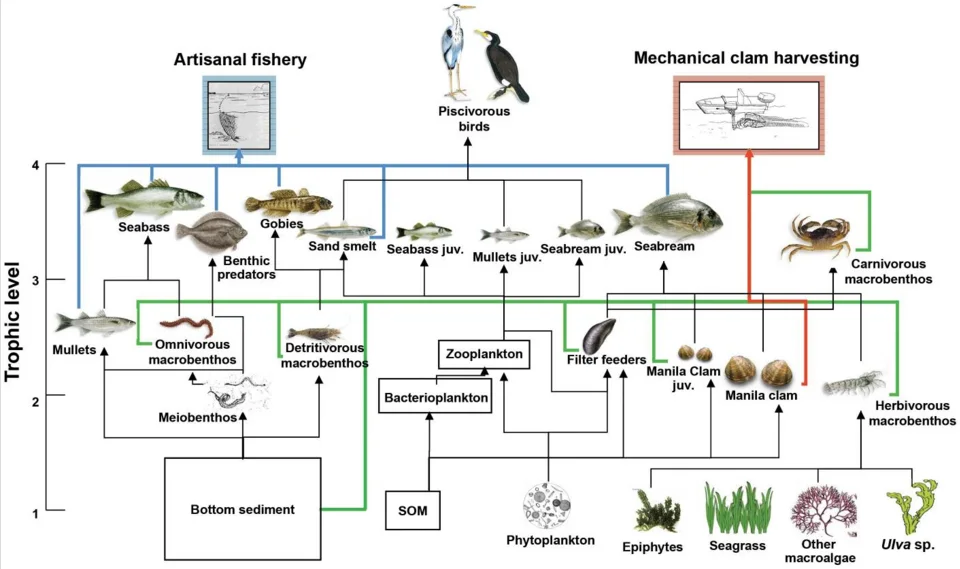
Venice lagoon food-web model with 27 nodes or functional groups: a comparative example of fisheries–ecosystem linkages.
Credit: Heymans, J.J., Coll, M., Libralato, S., Morissette, L. and Christensen, V. · CC BY 4.0 · sourceResized and converted to WebP; uncropped.
1. Meaning, structure and representation
A food chain traces one feeding pathway, whereas a food web combines the many pathways through which organisms obtain food. A grassland chain might be grass → grasshopper → frog → snake. In the actual ecosystem, grasshoppers may also be eaten by birds, snakes may consume rodents, and predators may share prey. The resulting network is a more realistic representation of ecological relationships than a single linear chain.
Food-web diagrams contain nodes, representing species or functional groups, and links, representing feeding relationships. Arrows conventionally run from food to feeder: phytoplankton → zooplankton means that zooplankton consume phytoplankton. A diagram is nevertheless a simplification because diets change with season, location, body size and life stage.
A species' trophic level describes its feeding position. Producers occupy level one, primary consumers level two, and secondary consumers level three. These are functional positions rather than permanent labels for species. A fish eating algae and insect larvae draws food from different trophic levels. Its trophic position can therefore be represented as a diet-weighted, non-integer value.
- Basal resources include living producers and non-living organic matter, or detritus.
- Intermediate consumers both eat other organisms and serve as food for higher consumers.
- An apex predator has no regular predator within the particular food web being considered; the term is ecosystem-specific.
2. Grazing, detrital and microbial pathways
The grazing pathway begins with living primary producers, including green plants, algae and cyanobacteria. Herbivores consume these producers and are themselves eaten by carnivores. Most ecosystems depend principally on photosynthesis, although chemosynthetic microorganisms support some food webs, such as those associated with deep-sea hydrothermal vents.
The detrital pathway begins with dead organic material, including fallen leaves, animal remains and faeces. Detritivores such as earthworms fragment or ingest this material. Decomposer bacteria and fungi break down organic compounds, commonly through extracellular digestion, and mineralisation returns inorganic nutrients to the environment. Detritivores and decomposers perform related but distinct functions.
Grazing and detrital pathways are interconnected rather than isolated systems. Consumers produce waste, all organisms eventually die, and predators may feed on detritivores. In forests, much primary production enters the detrital pathway through litter. In aquatic systems, the microbial loop allows bacteria to use dissolved organic matter; microbial grazers then transfer part of this production towards larger consumers.
Decomposers cannot accurately be assigned to a single final trophic level because they use organic material originating from many levels. Food webs also cross ecosystem boundaries: river-borne organic matter supports downstream consumers, while emerging aquatic insects provide food for terrestrial spiders and birds.
Connecting grazing and detrital pathways
- 1. Producers fix energy and assimilate inorganic nutrients.
- 2. Herbivores consume producers; predators consume other animals.
- 3. Uneaten material, wastes and dead organisms enter the detrital pool.
- 4. Detritivores and decomposers process organic matter.
- 5. Mineralisation makes nutrients available for producer uptake, while energy is progressively dissipated as heat.
3. Energy transfer, productivity and ecological pyramids
Primary producers convert external energy into chemical energy stored in organic matter. Gross primary productivity is the total rate of energy fixation; net primary productivity equals gross primary productivity minus producer respiration. Net primary productivity represents the production available for plant growth and reproduction, and ultimately to herbivores and detrital pathways.
Only a fraction of production at one trophic level becomes production at the next. Some material is not eaten, some is not assimilated, and much assimilated energy is used in respiration. Lindeman's approximately 10 per cent transfer principle is a useful textbook rule, not a universal ecological constant. Actual trophic transfer efficiency varies with organisms, food quality and environmental conditions.
Progressive energy loss limits the energy available to higher trophic levels and helps explain why food chains generally contain relatively few links. For illustration, if producer production is 10,000 kilojoules per square metre per year, successive transfers at an assumed 10 per cent efficiency would yield 1,000 and then 100 kilojoules per square metre per year.
The pyramid of energy is always upright when comparable areas and time periods are used. An aquatic biomass pyramid may be inverted because rapidly reproducing phytoplankton maintain a small standing biomass while supporting a larger consumer biomass. Standing biomass must therefore not be confused with productivity. Standard ecological pyramids also inadequately represent omnivory, shared species across chains and decomposer pathways.
| Concept pair | First concept | Second concept |
|---|---|---|
| Food chain / Food web | One linear feeding pathway | Network of interconnected feeding pathways |
| Energy / Nutrients | Flow through the system and dissipate as heat | Cycle through biotic and abiotic components |
| Detritivores / Decomposers | Ingest or fragment detritus | Chemically break down organic matter and contribute to mineralisation |
| Bioaccumulation / Biomagnification | Build-up within an organism | Increasing concentration across trophic levels |
| Standing biomass / Productivity | Living material present at a given time | Rate of production over a period |
4. Food-web dynamics and ecosystem stability
Bottom-up control occurs when resource availability, such as nutrients or producer productivity, influences higher trophic levels. Top-down control occurs when consumers regulate organisms below them. Both processes can operate simultaneously. A trophic cascade is an indirect effect that propagates across trophic levels, such as predator recovery reducing herbivore pressure and allowing vegetation to increase.
A keystone species has an ecological effect disproportionately large relative to its abundance. Removing a keystone predator can reorganise a food web, but not every apex predator is necessarily a keystone species. Foundation species, such as habitat-forming corals, influence communities substantially through habitat creation rather than only through predation.
Alternative prey and overlapping consumer roles may buffer a web against the loss of one feeding link. However, stability depends on interaction strength, species identity, network organisation and environmental variability, not simply on the number of species or links. Highly specialised consumers can be especially vulnerable when their principal food resource disappears.
Indirect interactions also matter. Two prey species sharing a predator may negatively affect one another even without competing for food: an increase in one prey may support more predators and intensify predation on the other. Such relationships explain why conserving an individual species without considering its ecological network can produce incomplete outcomes.
5. Human pressures and Indian conservation relevance
Habitat fragmentation, overharvesting, invasive alien species, pesticides and climate change can alter food-web links. Overfishing may remove large predators or important forage fish. Warming can change species distributions and the seasonal timing of plankton blooms, potentially creating mismatches between food availability and consumer demand.
Eutrophication illustrates multiple interacting pathways. Excess nitrogen and phosphorus can stimulate algal production; the subsequent decomposition of organic matter increases oxygen demand. Resulting hypoxia may kill fish and favour tolerant organisms. Thus, increased nutrient supply does not necessarily produce a healthier or more productive fish community.
Bioaccumulation is the build-up of a substance within an organism through environmental exposure and food intake. Biomagnification is an increase in its concentration across successive trophic levels. Persistent, poorly metabolised contaminants such as methylmercury and certain organochlorines can magnify in food webs, exposing top consumers to high concentrations. Not every pollutant biomagnifies.
Indian management applications include protecting wetland feeding habitats, maintaining river connectivity, conserving predator–prey relationships and regulating harmful chemicals. The Wild Life (Protection) Act, 1972 supports species protection, while the Wetlands (Conservation and Management) Rules, 2017 provide a regulatory framework for covered wetlands. Ecologically sound restoration must recover habitat, water quality and feeding relationships rather than merely increase the number of organisms released.
- In an examination diagram, determine arrow direction before identifying producers, consumers or the effects of species removal.
- Distinguish an immediate direct effect from a possible indirect cascade; outcomes depend on alternative food sources and other interactions.
- Reject absolute claims that all food chains begin with green plants, all consumers occupy one trophic level, or biodiversity always guarantees stability.
Food webs connect feeding relationships with ecosystem impacts
The supplied metadata describes a Venice lagoon food-web diagram with 27 nodes or functional groups, adapted from a trophic mass-balance study of mechanical clam dredging. Unlike a single food chain, a web represents interconnected feeding pathways. A node may aggregate organisms into a functional group rather than represent one species. Consumers feeding on resources at different trophic levels need not occupy a single integer trophic level. The metadata distinguishes flows associated with artisanal fishing, clam fishing and non-target species, making this a useful comparative example of how resource extraction intersects with ecological networks.
Fishing can affect organisms beyond the harvested population through altered prey availability, predator pressure and habitat disturbance. Such effects can propagate through a web, but their direction and magnitude depend on interaction strengths and environmental conditions. A mass-balance model accounts for trophic flows under specified assumptions; the diagram alone cannot establish causation or predict every response. Venice lagoon is an Italian case, not evidence about an Indian ecosystem. Its conceptual approach is relevant to Indian lagoons and estuaries, including Chilika, where fisheries management must consider feeding relationships alongside hydrology, habitat and livelihoods.
- Energy flows through trophic transfers and dissipates as heat; nutrients cycle through organisms, detritus and the physical environment.
- Bioaccumulation occurs within an organism; biomagnification is increasing contaminant concentration across trophic levels, not a universal property of pollutants.
- Greater web complexity does not automatically guarantee stability: interaction strengths, functional redundancy and disturbance type matter. Check arrow conventions before interpreting transfer direction.
Real-world case studies
Sea otters and North Pacific kelp forests
Sea otters consume sea urchins, which graze kelp. In several North Pacific systems, reduced otter abundance has allowed intense urchin grazing and loss of kelp habitat. Otter recovery can favour kelp persistence. This classic trophic cascade also shows how a predator indirectly supports habitat used by many other species; outcomes remain influenced by local conditions and other predators.
Veterinary diclofenac and Indian vultures
Vultures feeding on livestock carcasses containing diclofenac residues suffered fatal kidney damage, contributing to catastrophic declines in several Gyps species. India banned veterinary diclofenac in 2006. The episode demonstrates dietary transfer of a toxic substance and disruption of a scavenging pathway, not necessarily biomagnification across successive trophic levels. Protecting scavengers helps maintain carcass-removal functions.
Previous year questions
UPSC Prelims 2013
With reference to food chains in ecosystems, consider the statements: 1. A food chain illustrates the order in which organisms feed on one another. 2. Food chains occur within the population of a species. 3. A food chain illustrates the numbers of each organism eaten by others. Which statements are correct?
- A. 1 only
- B. 1 and 2 only
- C. 1, 2 and 3
- D. None
Practice questions
Practice MCQ 1
Consider the statements: 1. An omnivorous species may occupy more than one trophic level. 2. Decomposers obtain organic matter only from apex predators. 3. In a conventional food-web diagram, an arrow from grass to deer represents energy transfer to deer. Which statements are correct?
- A. 1 only
- B. 2 and 3 only
- C. 1 and 3 only
- D. 1, 2 and 3
Practice MCQ 2
A lake has a smaller standing biomass of phytoplankton than of zooplankton. Which explanation is most appropriate?
- A. Energy increases at each successive trophic level.
- B. Rapid phytoplankton turnover can support a larger consumer standing biomass.
- C. Zooplankton must obtain all their energy through chemosynthesis.
- D. The lake necessarily has an inverted energy pyramid.
Practice MCQ 3
Following a predator's removal, herbivores increase and vegetation declines. This is best described as:
- A. A top-down trophic cascade
- B. Biomagnification
- C. Primary succession
- D. Nutrient mineralisation
Mains practice · Food webs are essential to understanding ecosystem responses to human disturbance. Explain with examples, distinguishing energy flow from nutrient cycling. Answer in 150 words.
- Define food webs as interconnected feeding pathways, including grazing and detrital links.
- Explain unidirectional energy flow, respiratory losses and recycling of nutrients through decomposition.
- Discuss direct species loss, indirect trophic cascades and dietary transfer of contaminants.
- Use sea otter–urchin–kelp relationships and diclofenac-related vulture declines as examples.
- Conclude with habitat protection, pollution control and conservation of ecological interactions.
Further reading
- NCERT, Biology, Class XII: Ecosystem.
- NCERT, Biology, Class XII: Biodiversity and Conservation.
- Eugene P. Odum and Gary W. Barrett, Fundamentals of Ecology.
- Ministry of Environment, Forest and Climate Change: Action Plan for Vulture Conservation in India, 2020–2025.
- Ministry of Environment, Forest and Climate Change: Wetlands (Conservation and Management) Rules, 2017.
- https://commons.wikimedia.org/wiki/File:Food_web_of_the_Venice_lagoon.png
Preparing for UPSC Civil Services? Get classroom teaching, answer-writing evaluation and mentorship at Pragnya IAS Academy, Ashok Nagar — see why aspirants choose us for IAS coaching in Hyderabad.