
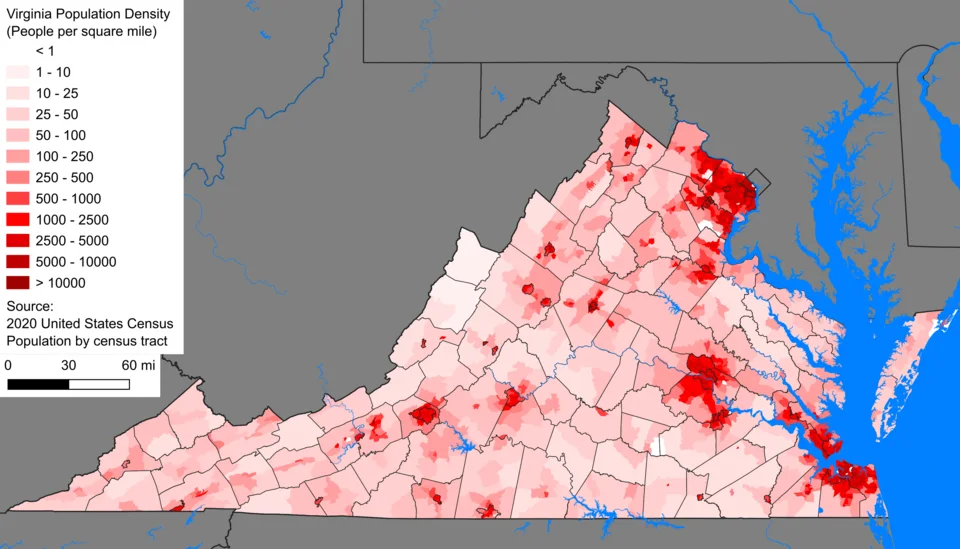
Comparative example: Virginia population density by census tract, based on the 2020 U.S. census.
Credit: Crossover1370 · CC0 · sourceResized and converted to WebP; uncropped.
1. Meaning, measurement and related concepts
Population density expresses the number of people occupying a unit of area, conventionally one square kilometre in India. Arithmetic density divides total population by total geographical area. It enables comparisons between differently sized regions: a large state may have a substantial population but moderate density, while a small territory may be extremely dense. Population distribution, by contrast, describes where people are located and the spatial pattern of settlement.
Other density measures answer different questions. Physiological density divides total population by arable land area and indicates potential pressure on the land resource used for cultivation. Agricultural density divides the agricultural population by agricultural land area; some statistical applications use the number of farmers and arable area instead. Definitions must therefore be checked before comparing sources. Neither measure is interchangeable with arithmetic density.
Density is also different from crowding. A city may have high residential density but adequate housing, public transport and open spaces. Conversely, a relatively low-density district can contain overcrowded settlements. Similarly, a high-density area need not have rapid current population growth: its concentration may reflect centuries of settlement rather than a recent demographic surge.
- Always identify the numerator, denominator, territorial unit and reference year.
- For the same population, a smaller area produces a higher arithmetic density.
- Persons per square kilometre is a unit of density; percentage is normally used for growth rates and urban population shares.
2. Census benchmarks and India's spatial pattern
Census 2011 recorded India's population at approximately 1.21 billion and its density at 382 persons per square kilometre, compared with 325 in 2001. This represents an increase of 57 persons per square kilometre. The official national density calculation excludes the area of Jammu and Kashmir under the occupation of Pakistan and China. Consequently, dividing the census population by India's full stated geographical area does not reproduce the published density figure.
The northern plains form India's most extensive belt of high rural population concentration. Bihar recorded 1,106 persons per square kilometre, West Bengal 1,028 and Uttar Pradesh 829. Fertile alluvium, relatively level terrain, water availability, irrigation and a long history of intensive cultivation supported closely spaced villages and large populations. High density in these states is not simply an outcome of metropolitan growth.
Kerala recorded 860 persons per square kilometre, reflecting dense settlement across much of its coastal and midland belt. Tamil Nadu recorded 555, supported by agricultural regions and an extensive urban-industrial network. Density within both states remains uneven. Coastal plains, river valleys and transport corridors generally support greater concentrations than steep or heavily forested interiors.
At the opposite extreme, Arunachal Pradesh recorded 17 persons per square kilometre, Mizoram 52 and Sikkim 86. Rugged relief, extensive forests, limited cultivable land and accessibility constraints help explain these low averages. Rajasthan's density of 200 conceals a strong internal contrast between the arid west and better-watered eastern districts. Delhi's exceptionally high density reflects metropolitan concentration rather than a predominantly agricultural settlement system.
- Memorise the 2011 state extremes: Bihar highest; Arunachal Pradesh lowest.
- Keep states separate from Union Territories when interpreting rankings.
- Do not automatically apply 2011 state figures to present boundaries: Telangana was created in 2014, and the former state of Jammu and Kashmir was reorganised in 2019.
How to analyse population density
- 1. Specify the territorial unit and reference year.
- 2. Select the appropriate population and area definitions.
- 3. Calculate density or obtain the official census value.
- 4. Compare with neighbouring regions and the national benchmark.
- 5. Explain the pattern using physical, economic and demographic factors.
- 6. Assess service needs and environmental pressures without treating density as a complete development indicator.
3. Factors controlling population density
Physical conditions influence the opportunities and costs of settlement. Level plains facilitate agriculture, construction and transport. Reliable water supplies support drinking needs, irrigation and industry, while fertile soils permit intensive cultivation. Steep slopes, extreme cold and aridity often restrict permanent settlement. These are tendencies, not absolute rules: irrigation, engineering and trade can sustain substantial populations in otherwise difficult environments.
Agricultural technology modifies the relationship between land and population. Multiple cropping, irrigation and productive farming systems can support more people per unit area than extensive rain-fed cultivation. However, dense agricultural populations may also experience fragmented holdings, disguised unemployment and pressure on common resources. High density alone does not establish that an area is prosperous or agriculturally sustainable.
Economic and historical factors are equally important. Ports, administrative capitals, mining centres and manufacturing clusters attract workers and services. Railways, roads and navigable waterways improve accessibility and encourage settlement along corridors. Colonial-era port development contributed to the growth of Mumbai, Kolkata and Chennai; later industrial and service-sector expansion strengthened metropolitan concentration.
Migration redistributes people between regions, while births and deaths change population within them. Employment, education, healthcare and social networks influence migration decisions. Political stability, land tenure, settlement history and public investment also shape density. A good explanation therefore combines physical geography with livelihoods and historical processes rather than attributing settlement patterns to climate alone.
- Physical factors: relief, water, soils, climate and terrain accessibility.
- Economic factors: agricultural productivity, industry, services and transport.
- Demographic and institutional factors: natural increase, migration, settlement history and public policy.
| Territory | Persons per square kilometre | Examination significance |
|---|---|---|
| India | 382 | National benchmark |
| Bihar | 1,106 | Highest among states |
| West Bengal | 1,028 | Second-highest among states |
| Arunachal Pradesh | 17 | Lowest among states |
| Mizoram | 52 | Low-density northeastern hill state |
| Sikkim | 86 | Low-density Himalayan state |
4. Developmental significance and planning applications
Population concentration can generate agglomeration economies: firms share labour markets, suppliers and infrastructure, while residents gain access to specialised services. Compact settlements can lower the per-person cost of water supply, sanitation and public transport. However, benefits depend on effective planning. Inadequate housing and infrastructure can turn concentration into congestion, pollution, unsafe construction and poor service access.
Density is useful for locating schools, health facilities, transport routes and emergency services. In sparse Himalayan or northeastern settlements, distance and difficult terrain can matter more than population thresholds alone. In dense urban neighbourhoods, planners must consider daytime populations, commuters and floating populations, not merely residents counted at their usual place of residence.
Indian programmes address different aspects of these spatial challenges. AMRUT 2.0 focuses on urban water security and associated services, while PMAY-U addresses urban housing needs. Rural road connectivity under Pradhan Mantri Gram Sadak Yojana improves access for eligible unconnected habitations. Such interventions demonstrate why planning must account for both concentration and remoteness rather than favouring only densely populated areas.
- High density can improve infrastructure efficiency but intensify pressure where capacity is inadequate.
- Low density can raise service-delivery costs without implying low development potential.
- Environmental carrying capacity depends on consumption, technology, ecosystems and governance as well as population.
5. Reading density maps and avoiding examination traps
State-level density maps simplify a highly uneven reality. A statewide average may combine crowded river valleys with sparsely populated uplands. District, town, ward and settlement-level data reveal progressively finer patterns. Comparisons can also change when boundaries are redrawn: a city's administrative limits may include agricultural land, whereas its continuously built-up area may be much smaller.
For UPSC, distinguish arithmetic density from population pressure on farmland, and total population from its concentration. Uttar Pradesh had India's largest state population in 2011, but Bihar had the highest state density. Kerala demonstrates that high density does not necessarily imply high contemporary fertility, while Bihar demonstrates that high density does not necessarily imply high urbanisation. Treat census observations, intercensal estimates and future projections as separate categories.
- Use like-for-like boundaries and years when comparing places.
- A dense region is not automatically overpopulated; adequacy of resources, employment and services must also be assessed.
- For map questions, first identify plains, coasts, mountain belts, deserts and major urban-industrial corridors.
Reading Population Density Across Spatial Scales
This map is described as presenting population density across census tracts in Virginia, United States, using the 2020 U.S. census. It is a comparative teaching example, not evidence about India's population distribution. Arithmetic population density divides the population of a defined territory by its land area. A tract-level map can reveal local variation that a state-wide average conceals, but the supplied metadata alone does not establish particular spatial patterns, legend classes or measurement units.
For India, the same principle applies when comparing national, state, district and smaller-area densities. Census 2011 recorded India's average density as 382 persons per square kilometre; this average should not be interpreted as uniform settlement. Relief, water, cultivable land, employment and connectivity influence concentrations of population. Density maps describe spatial outcomes rather than prove their causes: explaining a concentration requires additional evidence about migration, livelihoods and settlement history. Comparisons also require consistent reference years, area definitions and administrative boundaries.
- Distinguish measures: arithmetic density uses total land area; physiological density uses arable land; agricultural density relates agricultural population to arable land.
- Check aggregation: changing boundaries or combining units can alter mapped contrasts without any population movement. High density does not automatically mean high urbanisation.
- Use cautiously: Virginia's 2020 census-tract data cannot establish Indian regional rankings or be treated as directly equivalent to India's 2011 census figures.
Real-world case studies
Bihar: dense settlement without extensive urbanisation
Bihar combined a density of 1,106 persons per square kilometre with an urban population share of only about 11.3% in Census 2011. Its fertile Gangetic plains and long-established village network demonstrate that very high density can be predominantly rural. Planning priorities include non-farm employment, agricultural diversification, flood resilience and basic services.
Kerala: high density with advanced demographic transition
Kerala's density was 860 persons per square kilometre in 2011 despite its relatively low fertility and advanced demographic transition. Long-established settlement, coastal accessibility and dispersed towns help explain this combination. Continuous settlement along roads and between towns creates challenges for drainage, waste management and wetland protection.
Previous year questions
No source-linked PYQ is available here yet. Use the practice questions below.
Practice questions
Practice MCQ 1
With reference to population measures, consider the following statements: 1. Arithmetic density uses total geographical area as its denominator. 2. Physiological density uses arable land area as its denominator. 3. A rise in population density necessarily indicates a rise in the urban population share. Which statements are correct?
- A. 1 and 2 only
- B. 2 and 3 only
- C. 1 and 3 only
- D. 1, 2 and 3
Practice MCQ 2
According to Census 2011, which sequence arranges the following states in descending order of population density?
- A. West Bengal, Bihar, Uttar Pradesh, Kerala
- B. Bihar, West Bengal, Kerala, Uttar Pradesh
- C. Bihar, Kerala, West Bengal, Uttar Pradesh
- D. Kerala, Bihar, Uttar Pradesh, West Bengal
Practice MCQ 3
Two districts have identical total populations and geographical areas, but District X has half as much arable land as District Y. Which conclusion necessarily follows?
- A. District X has twice the arithmetic density of District Y.
- B. District X has half the physiological density of District Y.
- C. Both have identical arithmetic density, but District X has twice the physiological density.
- D. Both have identical agricultural density.
Mains practice · Explain the geographical pattern of population density in India. Why is density alone an inadequate indicator of population pressure and development? Answer in 250 words.
- Define arithmetic density and cite India's Census 2011 benchmark of 382 persons per square kilometre.
- Contrast the northern plains and dense coastal settlements with Himalayan, northeastern and arid regions.
- Explain relief, water, agricultural productivity, transport, industrialisation and migration.
- Use Bihar and Kerala to distinguish density from urbanisation and fertility.
- Discuss resources, consumption, technology, infrastructure and employment as mediating factors.
- Conclude with the need for finer-scale, boundary-consistent data and region-specific planning.
Further reading
- NCERT, India: People and Economy, Class XII, chapter Population: Distribution, Density, Growth and Composition.
- NCERT, Fundamentals of Human Geography, Class XII, chapter The World Population: Distribution, Density and Growth.
- Office of the Registrar General and Census Commissioner, India: Census 2011, A-01 table and Primary Census Abstract, censusindia.gov.in.
- Ministry of Housing and Urban Affairs: AMRUT 2.0 Operational Guidelines.
- https://commons.wikimedia.org/wiki/File:Virginia_population_density_2020.png
Preparing for UPSC Civil Services? Get classroom teaching, answer-writing evaluation and mentorship at Pragnya IAS Academy, Ashok Nagar — see why aspirants choose us for IAS coaching in Hyderabad.