
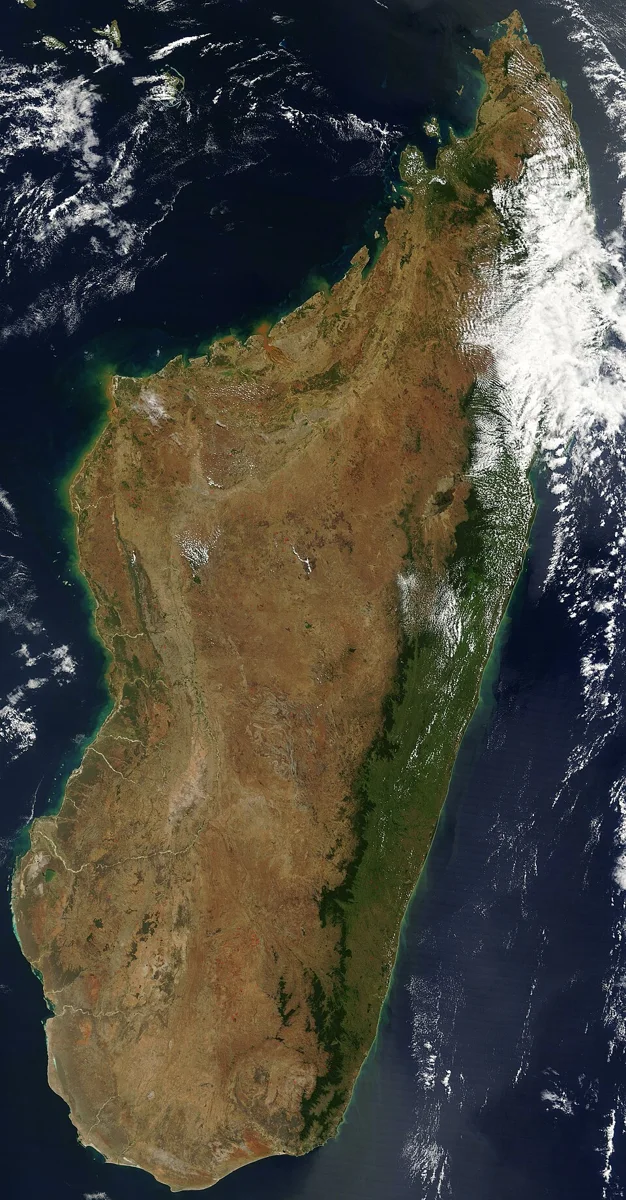
Madagascar imaged by Terra’s MODIS sensor on 10 September 2003: a comparative example of Earth observation.
Credit: Unknown authorUnknown author · Public domain · sourceResized and converted to WebP; uncropped.
1. Scientific basis and essential terminology
Earth observation converts measurements into information about the planet. Satellite remote sensing provides repeated coverage of large and inaccessible areas, while field observations help calibrate instruments and validate interpretations. A satellite image is not necessarily a conventional photograph: it may represent reflected visible light, infrared radiation, microwave backscatter or a derived quantity such as surface temperature.
Different materials interact differently with electromagnetic radiation. Vegetation strongly absorbs red light for photosynthesis and generally reflects near-infrared radiation; water usually absorbs much of the near-infrared and shortwave-infrared radiation reaching it. Soil reflectance changes with moisture, composition and surface conditions. These wavelength-dependent responses form spectral signatures, allowing analysts to distinguish land-cover classes. However, signatures are not unique fingerprints under all conditions.
Pixels are the basic elements of raster images. A pixel may contain several surface types, creating a mixed-pixel problem. Ground truth means independently collected reference information used to train or assess image interpretation. A geographic information system, or GIS, combines spatial datasets for analysis; remote sensing supplies observations, while GIS relates them to boundaries, roads, settlements and other information.
- False-colour composite: assigns selected spectral bands to display colours; vegetation commonly appears red when near-infrared is displayed in the red channel.
- NDVI: the Normalised Difference Vegetation Index equals near-infrared minus red reflectance divided by their sum. It indicates vegetation greenness, not crop yield directly.
Timeline
1972
The first Landsat satellite began a long-running programme of civilian land observation.
1979
Bhaskara-I advanced India’s experimental satellite remote-sensing capabilities.
1988
IRS-1A began India’s operational remote-sensing satellite series.
2022
India launched EOS-04 and EOS-06; the National Geospatial Policy was notified.
2025
The NASA–ISRO NISAR mission was launched.
2. Sensors, orbits and resolution
Passive optical sensors measure sunlight reflected by Earth in visible, near-infrared and shortwave-infrared bands. Clouds and darkness constrain these observations. Thermal infrared sensors measure emitted radiation and can operate at night, although clouds obstruct their view of the surface. Multispectral sensors measure several relatively broad bands; hyperspectral sensors measure many narrow, often contiguous bands, enabling finer discrimination of materials.
Active sensors supply their own energy. Synthetic Aperture Radar, or SAR, uses microwave signals and satellite motion to achieve fine imaging resolution. It is valuable for flood mapping, soil-moisture assessment and deformation studies. LiDAR measures the return time of laser pulses to estimate distance and elevation. Unlike microwave radar, optical laser measurements are substantially affected by clouds. Radar altimeters measure distance to the surface and support sea-level and ice studies.
Many mapping satellites use near-polar, sun-synchronous low Earth orbits, enabling broad coverage under comparable illumination. A geostationary satellite circles above the equator at about 35,786 kilometres and matches Earth’s rotation. It offers frequent regional weather observations but relatively poor polar viewing. Orbit choice involves trade-offs among coverage, revisit time, detail and mission purpose.
Spatial resolution describes the ground detail represented by measurements; spectral resolution concerns wavelength discrimination; radiometric resolution concerns sensitivity to differences in signal intensity; temporal resolution concerns observation frequency. Revisit time is not the same as usable cloud-free coverage. A smaller pixel does not automatically make a dataset more suitable: drought assessment may need frequent, wide-area observations more than building-level detail.
From satellite measurement to decision
- 1. Define the information need and select suitable sensors
- 2. Acquire imagery and reference observations
- 3. Apply radiometric, geometric and relevant atmospheric corrections
- 4. Derive indicators, classifications or change maps
- 5. Validate results and quantify uncertainty
- 6. Combine with GIS layers and issue actionable information
3. India’s satellites, institutions and policy framework
India’s remote-sensing programme developed from experimental Bhaskara missions to IRS-1A and specialised satellite families. Resourcesat supports land and agricultural monitoring; Cartosat provides high-resolution imagery for mapping and infrastructure; Oceansat supports ocean-colour and related marine observations; RISAT and subsequent radar-imaging missions strengthen microwave observation capability. INSAT meteorological instruments provide frequent imagery and atmospheric observations for weather services.
EOS, meaning Earth Observation Satellite, is a naming designation rather than one uniform sensor type. EOS-04, launched in February 2022, carries C-band SAR. EOS-06, launched in November 2022, continues Oceansat-related ocean-observation services. NISAR, jointly developed by NASA and ISRO and launched on 30 July 2025, combines L-band and S-band SAR to study changes in ecosystems, ice and the solid Earth.
NRSC distributes data and develops applications, while ISRO’s Space Applications Centre in Ahmedabad develops payloads and application systems. The Indian Institute of Remote Sensing in Dehradun provides education and capacity building. Bhuvan is ISRO’s geospatial platform for visualisation, thematic information and services. The India Meteorological Department and Indian National Centre for Ocean Information Services convert relevant observations into operational products.
The 2021 geospatial guidelines liberalised many geospatial-data activities for Indian entities, subject to specified conditions. The National Geospatial Policy, 2022 seeks stronger infrastructure, standards, accessibility and innovation. Indian Space Policy, 2023 expands the framework for non-government participation in space activities. These measures do not eliminate privacy concerns, security restrictions or the need to check dataset licensing and accuracy.
| Technique | Measured signal | Typical application | Main caution |
|---|---|---|---|
| Optical multispectral | Reflected sunlight | Crop and land-cover mapping | Clouds and darkness limit acquisition |
| Thermal infrared | Emitted thermal radiation | Surface temperature and fire detection | Cloud obstruction and emissivity effects |
| Synthetic Aperture Radar | Microwave backscatter | Floods, surface change and deformation | Speckle and viewing-geometry effects |
| LiDAR | Returned laser pulses | Elevation and vegetation structure | Clouds and sampling limitations |
| Satellite gravimetry | Changes in Earth’s gravity field | Regional mass and water-storage changes | Coarse resolution and indirect attribution |
4. Applications in development and environmental management
Agriculture uses satellite observations to map crop area, monitor vegetation condition and assess drought or flood damage. The FASAL programme combines space-based observations with agrometeorology, field information and modelling for crop forecasts. Under the Pradhan Mantri Fasal Bima Yojana ecosystem, technology can support yield estimation and loss assessment. Satellite-derived stress signals must be interpreted alongside crop calendars, rainfall, pests and irrigation conditions.
Water-resource applications include watershed planning, reservoir monitoring, snow-cover mapping and identifying potential groundwater zones. Most ordinary optical satellites do not directly image underground aquifers; groundwater prospects are inferred from surface geology, drainage, landforms and other evidence. Satellite gravimetry can detect regional changes in water storage, but separating groundwater from other water components requires additional information.
Forest observations support mapping of cover, fragmentation, fire and disturbance. Forest cover measured from canopy characteristics is not identical to legally recorded forest area or ecological quality. Ocean-colour observations help estimate chlorophyll concentration, while sea-surface temperature and other data support potential fishing-zone advisories. Atmospheric instruments monitor aerosols and selected gases, but satellite column measurements are not automatically equivalent to pollution concentrations at breathing height.
5. Disaster management, limitations and examination approach
Earth observation supports disaster risk reduction before, during and after an event. Baseline maps identify exposed settlements; near-real-time observations reveal inundation, cyclone structure or active fires; later images assist damage assessment and recovery planning. Interferometric SAR compares radar phase measurements to estimate ground displacement, supporting studies of earthquakes, subsidence and landslides. Such measurements do not provide reliable deterministic earthquake prediction.
Important limitations include cloud obstruction of optical imagery, radar speckle, terrain-induced radar distortion, atmospheric effects, inconsistent acquisition dates and uncertain classification. Floodwater beneath vegetation or among buildings can be difficult to map. Change detection requires comparable, corrected observations; otherwise differences in illumination, season or sensor characteristics may be mistaken for real environmental change.
For Prelims, match the physical measurement to the claimed application. Radar is not universally capable of seeing through buildings or deep underground, thermal imaging does not measure air temperature directly, and high spatial resolution does not guarantee high accuracy. Effective governance combines satellite data with field verification, transparent methods, uncertainty estimates and safeguards against misuse.
Earth observation: from satellite measurements to useful information
The supplied metadata identifies this image as a MODIS observation of Madagascar acquired by NASA’s Terra satellite. It provides a directly relevant, non-Indian example of satellite-based Earth observation, rather than evidence about Indian landscapes. MODIS measures radiation in multiple spectral bands, enabling applications such as vegetation monitoring, cloud assessment and detection of thermal anomalies. The source description reports active-fire markers and suggests agricultural burning as a possible explanation; that suggested cause is an interpretation, not something established by a satellite image alone.
Earth observation converts sensor measurements into information through calibration, georeferencing and analytical processing. Different spectral bands help distinguish surface properties, while spatial resolution determines the detail that can be resolved and temporal resolution governs how frequently changes can be tracked. In India, comparable methods support crop-condition assessment, forest-fire alerts, drought monitoring and disaster response through Earth observation missions and geospatial services. However, broad-area monitoring does not automatically provide field-level accuracy. Reliable decisions often require repeated observations, weather information and ground verification.
- Active-fire detection identifies thermal anomalies; it does not by itself establish the ignition cause, burned area or ecological damage. These require additional observations and analysis.
- Optical observations can be obstructed by clouds. Microwave radar generally supports cloud-penetrating, day-and-night observation, but measures different surface responses and requires different interpretation.
- Do not confuse platforms with sensors: Terra is the satellite platform and MODIS is its instrument. Likewise, an image product is processed information, not necessarily an unmodified photograph.
Real-world case studies
Kerala floods, 2018
NRSC used satellite observations to generate flood-inundation information during the Kerala floods. Radar observations were particularly useful under monsoon cloud cover. Combining inundation maps with settlement and transport layers supported situational assessment, although field verification remained necessary.
Groundwater depletion in northwestern India
A 2009 Nature study using NASA’s GRACE satellite measurements estimated groundwater depletion of about 17.7 cubic kilometres annually across Rajasthan, Punjab, Haryana and Delhi during August 2002–October 2008. The estimate combined gravity-derived storage changes with information on other water components; GRACE did not directly photograph aquifers.
Previous year questions
No source-linked PYQ is available here yet. Use the practice questions below.
Practice questions
Practice MCQ 1
Consider the following statements: 1. Thermal infrared sensors can collect useful observations at night. 2. Passive optical sensors generally provide unobstructed surface observations through thick clouds. 3. SAR instruments transmit microwave energy. Which statements are correct?
- A. 1 and 2 only
- B. 2 and 3 only
- C. 1 and 3 only
- D. 1, 2 and 3
Practice MCQ 2
A district requires frequent mapping of flood extent during a persistently cloudy monsoon. Which dataset is generally most suitable?
- A. Visible-band imagery alone
- B. Synthetic Aperture Radar imagery
- C. Night-time photographs alone
- D. A single pre-monsoon vegetation-index map
Practice MCQ 3
Which statement correctly distinguishes remote-sensing resolutions?
- A. Spectral resolution describes the interval between successive satellite visits.
- B. Temporal resolution describes the number of image pixels.
- C. Radiometric resolution concerns discrimination of signal-intensity differences.
- D. Spatial resolution measures only the number of spectral bands.
Mains practice · Explain how Earth observation strengthens climate-resilient development in India. Discuss the limitations of satellite-derived information and measures required for its effective use. Answer in 250 words.
- Introduce repeated, large-area observations and their integration with GIS.
- Discuss agriculture, water security, forests, coastal monitoring and disaster management.
- Use Resourcesat, radar missions, FASAL and flood mapping as examples.
- Explain cloud cover, resolution trade-offs, indirect inference and validation requirements.
- Recommend interoperable data, local capacity, field observations and uncertainty disclosure.
- Conclude with accessible services and responsible data governance.
Further reading
- NCERT, Practical Work in Geography, Part I: Introduction to Remote Sensing.
- ISRO official website: Earth Observation Satellites and mission pages.
- National Remote Sensing Centre: applications, disaster-management support and Bhuvan resources.
- Department of Science and Technology: Geospatial Guidelines, 2021 and National Geospatial Policy, 2022.
- NASA–ISRO NISAR mission website: science and radar fundamentals.
- USGS Landsat Missions: remote-sensing concepts and data products.
- https://commons.wikimedia.org/wiki/File:Satellite_image_of_Madagascar_in_September_2003.jpg
Preparing for UPSC Civil Services? Get classroom teaching, answer-writing evaluation and mentorship at Pragnya IAS Academy, Ashok Nagar — see why aspirants choose us for IAS coaching in Hyderabad.