
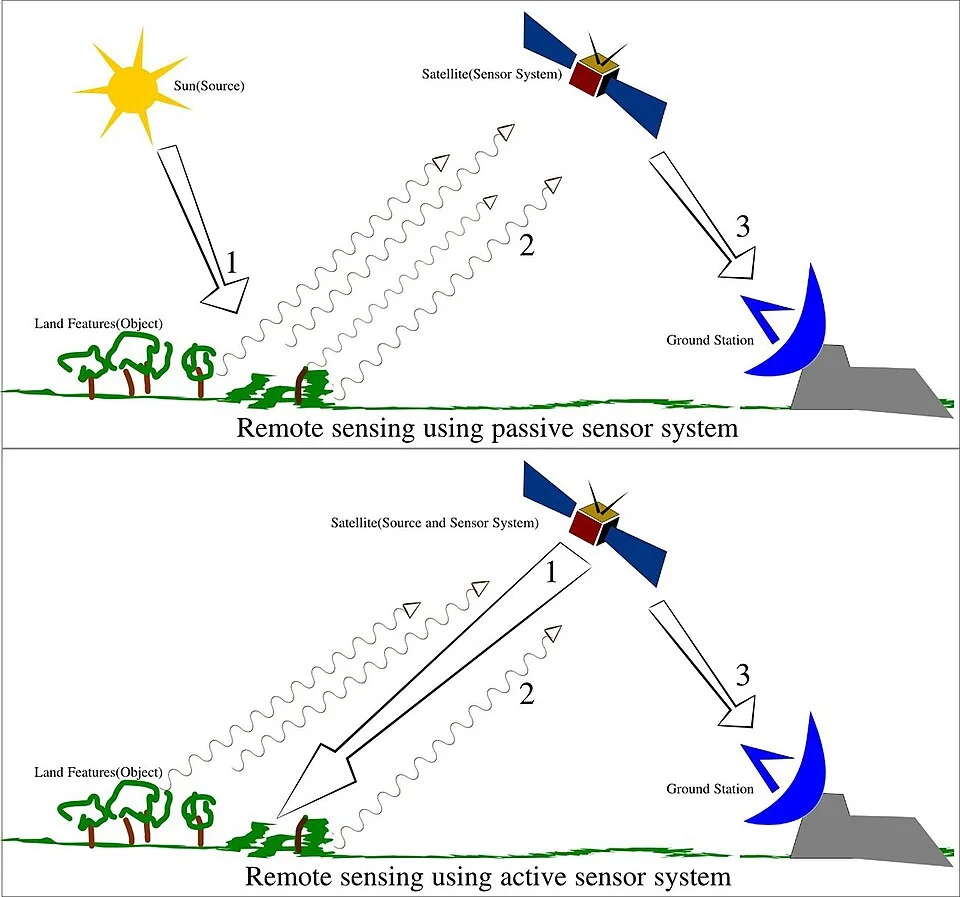
Conceptual illustration of remote sensing.
Credit: Arkarjun · CC BY-SA 3.0 · sourceResized and converted to WebP; uncropped.
1. Physical basis and interpretation
In space technology, remote sensing generally refers to observing the Earth through satellite-borne instruments. Aircraft, drones and ground-based instruments also perform remote sensing. Sensors detect electromagnetic energy across selected wavelength ranges, called spectral bands. The resulting measurements are processed into images or quantitative products such as vegetation indices, rainfall estimates and sea-surface temperature maps.
Radiation reaching a surface may be reflected, absorbed or transmitted. Its interaction depends on wavelength and the physical and chemical properties of the material. Vegetation, water, soil and built-up surfaces therefore have different spectral responses. Comparing these responses helps identify land cover, crop condition and environmental change. Interpretation also uses shape, size, texture, pattern, shadows and spatial association.
Healthy green vegetation absorbs much visible red light because of chlorophyll and strongly reflects near-infrared radiation because of leaf structure. Water generally absorbs strongly in near-infrared and shortwave infrared wavelengths, although suspended sediment and shallow bottoms alter its response. These contrasts explain why multispectral imagery can distinguish features that look similar to the human eye.
The atmosphere scatters and absorbs radiation. Sensors consequently use atmospheric windows where transmission is relatively high. In a common false-colour composite, near-infrared, red and green bands are displayed as red, green and blue respectively, making healthy vegetation appear red. These displayed colours represent a band assignment, not the object's actual visible colour.
- Electromagnetic spectrum sequence: visible light, infrared and microwaves have progressively longer wavelengths.
- A spectral signature is a pattern of reflectance or emission across wavelengths; moisture, season and viewing conditions can change it.
- A pixel is an image element representing a measurement over a ground footprint; it need not contain only one land-cover type.
2. Sensors: passive, active, optical and microwave
Passive optical sensors measure reflected sunlight in visible, near-infrared and shortwave infrared bands. They generally require daylight and cannot reliably observe the surface through thick cloud. Passive thermal infrared instruments instead measure radiation emitted by surfaces and clouds. They can work by day or night, although clouds and atmospheric effects complicate surface-temperature retrieval. Passive microwave radiometers measure naturally emitted microwave radiation and support studies of rainfall, soil moisture and ocean conditions.
Active sensors supply their own energy. Radar transmits microwave pulses and measures the returned signal, or backscatter. Synthetic Aperture Radar, or SAR, combines observations along a moving platform's flight path to obtain fine spatial resolution. Radar works without sunlight and can generally image through clouds, making it valuable during monsoon floods. However, radar is not unaffected by every weather condition: attenuation and scattering depend on wavelength and precipitation intensity.
Radar backscatter depends on surface roughness, moisture, geometry and wavelength. Longer wavelengths can penetrate vegetation more effectively than shorter ones under suitable conditions, but radar does not universally see through buildings, forests or deep underground. Interferometric SAR compares phase information from repeated observations to estimate elevation or ground displacement. LiDAR measures laser returns to map terrain, canopy structure and built environments; unlike microwave radar, it is strongly constrained by clouds.
- Multispectral sensors measure several separate bands; hyperspectral sensors measure many narrow, usually contiguous bands.
- Radar altimeters measure range to surfaces and support ocean-height and ice studies.
- Optical and radar observations are complementary rather than interchangeable.
From satellite observation to decision support
- 1. Define the problem and required spatial, spectral and temporal detail.
- 2. Select suitable sensors and acquire observations.
- 3. Calibrate and geometrically correct data; apply relevant atmospheric corrections.
- 4. Derive indices, classifications or physical-parameter estimates.
- 5. Validate results with field observations and independent datasets.
- 6. Integrate outputs into GIS and communicate uncertainty to decision-makers.
3. Resolution, orbits and data processing
Spatial resolution describes the ground detail that a sensor can distinguish, commonly expressed through pixel size. A smaller ground sampling distance generally captures finer detail. Spectral resolution describes the ability to distinguish wavelength intervals; radiometric resolution describes the ability to discriminate signal-intensity levels; temporal resolution describes how frequently observations of a location are available. High spatial resolution does not automatically imply superior performance for every application.
A 12-bit sensor can encode 4,096 digital levels, compared with 256 for an 8-bit sensor. Narrow spectral bands may help discriminate minerals or vegetation types, whereas frequent revisits are crucial for tracking rapidly changing floods. Design involves trade-offs among pixel size, swath width, signal quality, data volume and revisit frequency. Actual usable optical coverage also depends on cloud conditions.
Many mapping satellites operate in near-polar, sun-synchronous low Earth orbits. They pass locations at approximately the same local solar time, supporting comparable illumination conditions. A geostationary satellite follows a circular equatorial orbit roughly 35,786 km above Earth and appears fixed relative to the ground. Its continuous regional view is valuable for cyclone tracking and weather monitoring, but it provides less favourable viewing geometry at high latitudes.
Raw observations require calibration, geometric correction and often atmospheric correction before analysis. Classification groups pixels into categories such as forest, cropland or water. Ground observations are essential for training and validation. A Geographic Information System, or GIS, stores and analyses geographically referenced layers; remote sensing supplies many of those layers but is not synonymous with GIS.
- Revisit interval and exact ground-track repeat cycle are not necessarily identical.
- Cloud-free temporal availability can be lower than the nominal revisit frequency.
- Georeferencing connects observations to geographic coordinates; orthorectification corrects geometric distortions including terrain effects.
| Technique | Energy source | Night operation | Principal limitation or use |
|---|---|---|---|
| Visible and near-infrared imaging | Reflected sunlight | Generally no | Cloud-sensitive; useful for land cover and vegetation |
| Thermal infrared imaging | Naturally emitted radiation | Yes | Cloud obstruction; surface and cloud-top temperature estimation |
| Passive microwave radiometry | Naturally emitted microwaves | Yes | Often coarse spatial resolution; moisture and atmospheric applications |
| Synthetic Aperture Radar | Transmitted microwave pulses | Yes | Cloud-penetrating capability; interpretation affected by geometry and speckle |
| LiDAR | Transmitted laser pulses | Yes | Cloud-sensitive; precise elevation and vegetation-structure mapping |
4. Indian missions and institutional framework
India's experimental Bhaskara-I and Bhaskara-II satellites preceded the operational Indian Remote Sensing programme. IRS-1A established a major indigenous capability for systematic natural-resource observations. Subsequent missions developed specialised strengths: Resourcesat supports land-resource monitoring, Cartosat supports high-resolution mapping, Oceansat observes ocean-related parameters, and radar missions provide observations less constrained by cloud and darkness.
EOS-04, launched in February 2022, carries a C-band SAR for applications including agriculture, forestry, soil moisture and flood mapping. EOS-06, launched in November 2022, continues ocean-observation capabilities with instruments including an Ocean Colour Monitor and a sea-surface temperature monitor. INSAT-3D and INSAT-3DR provide geostationary meteorological observations through imagers and sounders. Mission capabilities should be distinguished by their actual instruments rather than inferred from the satellite name.
The National Remote Sensing Centre, headquartered in Hyderabad, is an ISRO centre responsible for major Earth-observation data acquisition, processing, dissemination and applications activities. Its Bhuvan platform provides geospatial visualisation and thematic services. The Space Applications Centre in Ahmedabad develops payloads and applications, while the Indian Institute of Remote Sensing in Dehradun provides education and capacity building. The Indian Space Policy 2023 expands the framework for non-government participation across space activities, including Earth observation.
- Resourcesat: crop and land-resource monitoring through multispectral observations.
- Cartosat: mapping, infrastructure planning and terrain-related applications.
- Oceansat: ocean colour, marine productivity and related oceanographic observations.
- INSAT meteorological instruments: cloud systems, atmospheric profiles and weather monitoring.
5. Applications, indices and limitations
Agricultural applications include crop-area estimation, crop-condition assessment, drought monitoring and yield forecasting. India's FASAL programme integrates space-based observations with agrometeorological and other inputs for agricultural output forecasting. NADAMS supports agricultural drought assessment. Forest monitoring uses satellite imagery to assess forest cover and change, but satellite-derived forest cover is not identical to legally recorded forest area and does not by itself establish biodiversity quality.
The Normalised Difference Vegetation Index is calculated as NDVI = (NIR − Red) / (NIR + Red). Larger positive values commonly indicate denser green vegetation, but soil background, atmospheric effects and saturation in dense vegetation limit interpretation. NDVI is not a direct measurement of crop yield. Ocean-colour data help estimate chlorophyll-related conditions, while combined ocean observations support potential fishing-zone advisories issued by INCOIS.
Disaster applications include cyclone monitoring, flood-inundation mapping, landslide inventories, forest-fire detection and post-disaster damage assessment. Hydrological applications include watershed planning, snow-cover assessment and groundwater-potential mapping. Groundwater-potential maps usually infer favourable conditions from geology, drainage and landforms; they are not direct photographs of underground aquifers.
Important limitations include cloud obstruction, mixed pixels, classification errors, sensor differences and inadequate ground validation. A change in an image may reflect seasonal variation rather than permanent land-use change. Satellite evidence is powerful for public administration, but causal conclusions, property boundaries and legal findings may require field surveys and additional records. Exam questions often test these distinctions rather than mission-name recall alone.
- Remote sensing can identify patterns and support estimates; not every derived product is a direct physical measurement.
- Surface temperature differs from near-surface air temperature.
- High-resolution imagery raises privacy and security questions alongside its planning benefits.
Remote sensing: interpreting signals from a distance
Remote sensing infers surface or atmospheric properties from electromagnetic signals rather than direct contact. The supplied metadata identifies this image as a remote-sensing illustration; it does not establish which sensors or processes are depicted. Passive sensors measure naturally available radiation, including reflected sunlight and emitted thermal energy. Active sensors transmit energy and measure the return, as in radar and lidar. Passive sensing is therefore not synonymous with daylight-only observation: thermal infrared sensors can operate at night.
Useful interpretation depends on wavelength, resolution and observation conditions. Optical imagery can distinguish vegetation, water and built-up areas, but clouds often obstruct surface observations. Microwave radar can operate day and night and generally penetrates cloud cover, making it valuable during floods; this does not mean it sees through every material or measures flood depth directly. In India, Earth-observation data support crop assessment, watershed planning, cyclone monitoring and disaster mapping. Satellite signals usually require calibration, processing and validation against ground observations before they support reliable decisions.
- Spatial resolution concerns ground detail; temporal resolution concerns repeat observations. Spectral resolution distinguishes wavelength intervals, while radiometric resolution distinguishes signal intensity.
- Geostationary platforms enable frequent monitoring of broad regions; polar-orbiting platforms support repeated global coverage. Orbit alone does not determine image resolution.
- Vegetation indices indicate spectral responses associated with vegetation, not direct measurements of crop yield. Mains answers should connect applications with uncertainty, ground validation and institutional capacity.
Real-world case studies
Kerala floods, 2018
During the August 2018 floods, NRSC used satellite observations to generate inundation information for affected areas. Radar observations were particularly valuable under monsoon cloud cover. The case illustrates why disaster mapping requires rapid acquisition, complementary sensors and comparison with pre-flood conditions rather than reliance on optical imagery alone.
Potential fishing-zone advisories in India
INCOIS uses satellite-derived ocean information, including sea-surface temperature and chlorophyll-related products, to identify potentially productive fishing areas. Advisories translate remote observations into livelihood support. They indicate favourable zones, not guaranteed catches, and must be distinguished from ocean-state forecasts and weather warnings.
Previous year questions
UPSC Prelims 2015
In which of the following can remote-sensing technology be used: 1. Estimation of chlorophyll content of vegetation in a specific location; 2. Estimation of greenhouse gas emissions from rice paddies in a specific location; 3. Estimation of land-surface temperatures in a specific location?
- A. 1 only
- B. 2 and 3 only
- C. 1 and 3 only
- D. 1, 2 and 3
Practice questions
Practice MCQ 1
Consider the following statements: 1. Every passive remote-sensing instrument requires sunlight. 2. SAR instruments transmit their own microwave energy. 3. Thermal infrared instruments can observe emitted radiation at night. Which statements are correct?
- A. 1 and 2 only
- B. 2 and 3 only
- C. 1 and 3 only
- D. 1, 2 and 3
Practice MCQ 2
A satellite system is modified to observe the same location more frequently, while pixel size and spectral bands remain unchanged. Which characteristic is primarily improved?
- A. Spatial resolution
- B. Spectral resolution
- C. Temporal resolution
- D. Radiometric resolution
Practice MCQ 3
Consider the following pairs: 1. Cartosat — High-resolution mapping; 2. Oceansat — Ocean observations; 3. NavIC — Primarily multispectral crop imaging. How many pairs are correctly matched?
- A. Only one
- B. Only two
- C. All three
- D. None
Mains practice · Explain how satellite remote sensing strengthens disaster management and natural-resource governance in India. Discuss the limitations of relying exclusively on satellite-derived information. Answer in 250 words.
- Define remote sensing and distinguish active radar from passive optical and thermal observations.
- Discuss cyclone tracking, flood mapping, drought assessment and damage estimation.
- Connect Resourcesat, radar missions, Oceansat and INSAT capabilities to specific applications.
- Explain the roles of NRSC, Bhuvan and integration with GIS.
- Address clouds, resolution trade-offs, mixed pixels, modelling assumptions and classification uncertainty.
- Conclude with ground validation, inter-agency coordination and timely public access to usable information.
Further reading
- NCERT, Practical Work in Geography, Part II, Class XII: Spatial Information Technology.
- ISRO official website: Earth Observation Satellites and mission pages for IRS-1A, EOS-04 and EOS-06.
- National Remote Sensing Centre: Earth-observation applications, disaster-management products and Bhuvan.
- Indian Institute of Remote Sensing: educational resources on remote sensing and geoinformatics.
- INCOIS official website: Potential Fishing Zone Advisory Services.
- Department of Space: Indian Space Policy 2023.
- https://commons.wikimedia.org/wiki/File:Remote_Sensing_Illustration.jpg
Preparing for UPSC Civil Services? Get classroom teaching, answer-writing evaluation and mentorship at Pragnya IAS Academy, Ashok Nagar — see why aspirants choose us for IAS coaching in Hyderabad.