
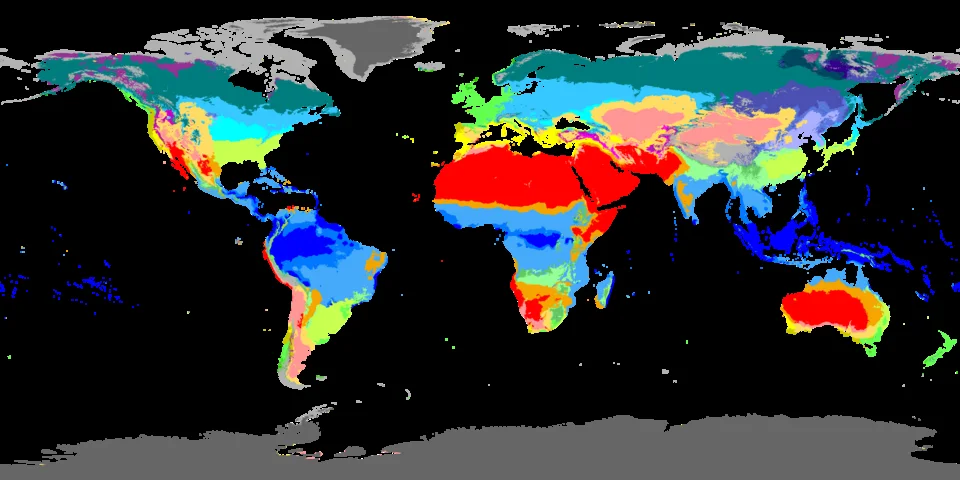
Global Köppen–Geiger climate classification for 1980–2016, presented as a borderless world map.
Credit: Beck, H.E., Zimmermann, N. E., McVicar, T. R., Vergopolan, N., Berg, A., & Wood, E. F. · CC BY-SA 4.0 · sourceResized and converted to WebP; uncropped.
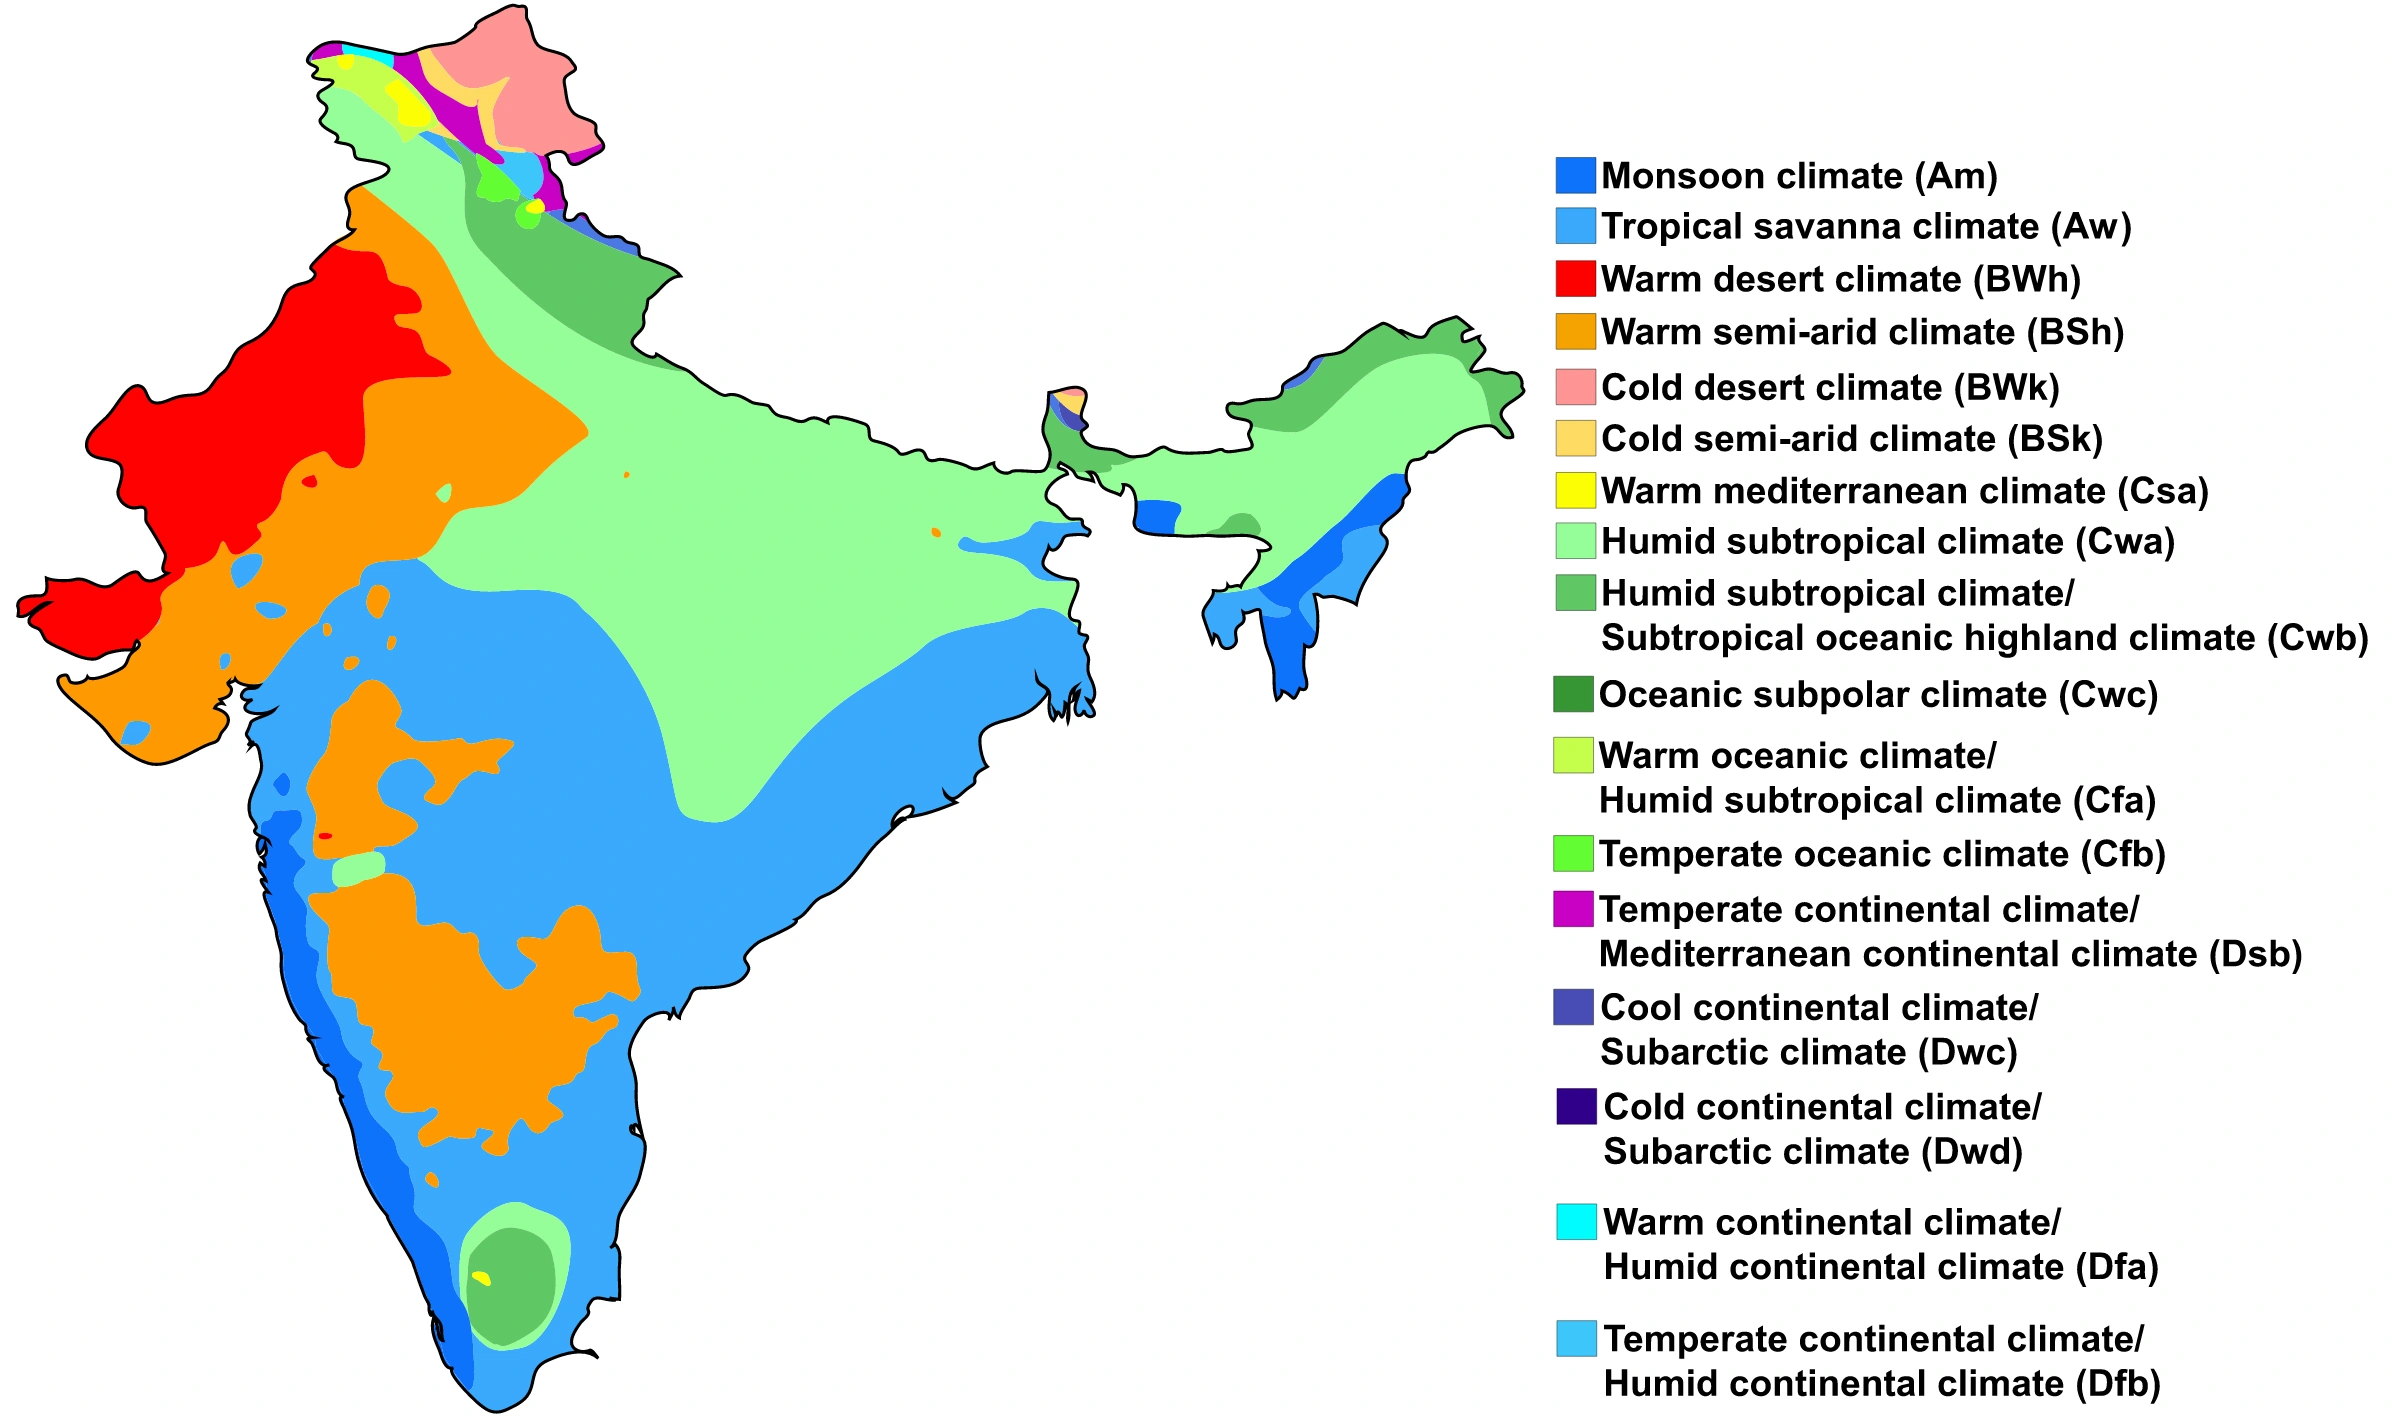
Map study
Köppen climate zones of India: compare arid, tropical and mountain classes. Long-term climate classes are not daily weather.
- Read the source legend, scale and reference period before comparing regions.
- Connect spatial patterns to the processes discussed in this topic; this map is a study reference, not live operational data.
Credit: Ali Zifan · CC BY-SA 4.0 · sourceConverted to WebP on an opaque white background; proportionally resized without cropping. Original cartography and legend retained.
1. Why and how climates are classified
Climate classification simplifies the continuous variation of the atmosphere into recognisable geographical regions. It helps explain vegetation, soil formation, water availability, agriculture and settlement patterns. A climatic region is an area sharing selected atmospheric characteristics, not an area where every day has identical weather. Climate normals summarise long-term conditions, but classifications may also use monthly means, rainfall seasonality and the frequency of particular conditions.
Empirical classifications group climates using observed effects or measurable variables, especially temperature and precipitation. Köppen’s system is the best-known example. Genetic classifications instead emphasise the causes of climate, such as solar radiation, atmospheric circulation, air masses and fronts. Tor Bergeron’s air-mass framework and the circulation-based approach associated with H. J. Critchfield illustrate the importance of atmospheric processes in understanding regional climates.
A useful classification should distinguish meaningful regions without becoming excessively complicated. However, climate varies gradually across space, whereas maps usually draw sharp boundaries. Transition zones, mountain slopes and coastal belts therefore require caution. A classification suitable for mapping natural vegetation may be less suitable for irrigation planning, urban heat assessment or evaluating extreme rainfall.
- Temperature reflects latitude, altitude, continentality, ocean currents and atmospheric circulation.
- Precipitation amount and seasonality distinguish climates that may have similar annual temperatures.
- Natural vegetation can indicate climatic conditions, but soils, fire, grazing and land-use change also influence it.
2. Köppen’s framework and major climate groups
Wladimir Köppen developed and repeatedly revised a climate classification linking temperature and precipitation to broad vegetation patterns. Later refinement produced the widely used Köppen–Geiger framework. Its letter codes combine a major climate group with precipitation characteristics and, where applicable, summer or winter temperature characteristics. Read each symbol in the context of its climate group rather than treating every letter as universally interchangeable.
Group A comprises tropical climates in which every month has a mean temperature of at least 18°C. Group B comprises dry climates where precipitation falls below a calculated aridity threshold. Group C comprises warm temperate climates: the coldest month is below 18°C but above a lower boundary commonly taken as −3°C in traditional treatments or 0°C in many modern implementations; the warmest month exceeds 10°C. Group D lies on the colder side of this C–D boundary and has a warmest month above 10°C. Group E has a warmest month below 10°C.
Because dryness is tested separately, a hot location does not automatically belong to Group A. Likewise, a dry region can be hot or cold. Some educational maps add H for highland climates, but H is not one of Köppen’s original five principal groups. Highlands contain strong local variation caused by elevation, slope aspect, rain shadows and valley circulation.
- In A climates, f denotes rainforest, m monsoon and w a dry winter.
- In C and D climates, f indicates no qualifying dry season, s a dry summer and w a dry winter.
- In B climates, W denotes desert and S steppe; h indicates mean annual temperature of at least 18°C and k below 18°C.
- In C and D climates, a indicates a hot summer with the warmest month at least 22°C; b indicates a cooler summer with at least four months above 10°C.
Reading a Köppen climate classification
- 1. Collect long-term monthly mean temperature and precipitation data.
- 2. Calculate annual temperature, annual precipitation and rainfall seasonality.
- 3. Test the temperature-adjusted dryness threshold to identify Group B.
- 4. For non-B climates, use coldest- and warmest-month temperatures to identify A, C, D or E.
- 5. Apply the relevant precipitation-seasonality and thermal-subtype criteria.
- 6. Check the classification convention and interpret the result using location, relief and circulation.
3. Rainfall thresholds and important climate types
Within Group A, Af requires at least 60 mm precipitation in the driest month. Am has a driest month below 60 mm but at least the value obtained from 100 minus annual precipitation divided by 25, with precipitation measured in millimetres. Aw has a dry winter that fails this monsoon threshold; As is its less common dry-summer counterpart. Thus, a monsoon-influenced location need not carry the Am code: the classification depends on rainfall statistics, not simply the presence of monsoon winds.
For Group B, a common Köppen–Geiger formulation sets the annual precipitation threshold in millimetres at 20 times mean annual temperature in degrees Celsius, with a seasonal adjustment. Add 280 where at least 70% of precipitation falls in the summer half-year, 0 where at least 70% falls in the winter half-year, and 140 otherwise. Annual precipitation below half the threshold gives BW desert; precipitation from half the threshold to below the full threshold gives BS steppe. Summer rainfall receives the larger adjustment because it coincides with greater evaporative demand.
Mediterranean climates, typically Csa or Csb, have dry summers and wetter winters. Subtropical high pressure suppresses summer rainfall, while winter westerlies and cyclonic systems bring precipitation. Marine west-coast climates such as Cfb generally have moderate temperatures and precipitation throughout the year. Humid continental and subarctic climates belong to D and are extensive across northern continental interiors. ET tundra has a warmest month between approximately 0°C and 10°C; EF ice-cap climate has no month averaging above freezing.
- Typical Af regions include parts of the Amazon Basin, Congo Basin and equatorial Southeast Asia.
- Mediterranean climates also occur in central Chile, southwestern Australia, the Cape region and coastal California.
- Extensive D climates are largely absent from the Southern Hemisphere because little land occupies the relevant middle and high latitudes.
| Code | Climate type | Diagnostic feature | Representative region |
|---|---|---|---|
| Af | Tropical rainforest | All months at least 18°C; driest month at least 60 mm rainfall | Parts of the equatorial Amazon Basin |
| Aw | Tropical savanna | Hot throughout the year with a pronounced dry winter | Large parts of interior tropical India |
| BWh | Hot desert | Desert precipitation criterion; mean annual temperature at least 18°C | Sahara and western Rajasthan |
| Csa | Hot-summer Mediterranean | Dry summer; warmest month at least 22°C | Lowlands around the Mediterranean |
| Dfc | Subarctic | Cold winter; no qualifying dry season; one to three months above 10°C | Parts of interior Canada and Siberia |
| ET | Tundra | Warmest month approximately 0–10°C | Arctic coastal margins |
4. Thornthwaite and applications to India
C. W. Thornthwaite’s 1948 approach evaluates climate through water balance. Potential evapotranspiration, or PET, represents atmospheric evaporative demand under conditions of adequate water availability. Comparing precipitation with PET and accounting for soil-water storage identifies moisture surplus and deficit. Moisture indices distinguish perhumid, humid, subhumid, semiarid and arid conditions; thermal efficiency and seasonal moisture distribution provide further differentiation.
This approach shows why equal annual rainfall need not produce equal moisture conditions. A cooler region generally has lower evaporative demand than a hotter region. The method is useful for agricultural climatology and drought assessment, although temperature-based PET estimates may not adequately represent the effects of wind, humidity and radiation everywhere.
India’s climatic diversity reflects latitude, the Himalaya, the monsoon, continentality and relief. Broad textbook patterns include Am along parts of the very wet western coast, Aw over substantial parts of peninsular India, BSh in dry rain-shadow interiors, BWh in western Rajasthan and Cwa across much of the northern plains. Himalayan climates change rapidly with elevation and exposure. These are generalisations: station data, the mapping period and classification version can alter local boundaries.
- The windward Western Ghats and leeward Deccan demonstrate the climatic importance of orographic rainfall and rain shadows.
- Tamil Nadu’s substantial October–December rainfall cautions against assuming that all Indian locations have the same rainfall seasonality.
5. Interpretation, limitations and examination approach
Climate classifications describe patterns rather than fully explaining them. Annual and monthly averages can conceal heatwaves, cloudbursts, drought sequences and rainfall intensity. They also simplify influences such as urbanisation, irrigation and local topography. Agro-climatic and agro-ecological regionalisations therefore incorporate additional information, including soils, growing periods and agricultural requirements.
Climate boundaries are not permanent. Warming or changing rainfall seasonality can shift the statistical category assigned to a location. Such reclassification does not mean that vegetation or soils change immediately: ecological responses involve time lags and human intervention. When comparing maps, check their reference periods, spatial resolution and threshold conventions.
For Prelims, first identify the major group, then rainfall seasonality, and finally the thermal subdivision. Connect each climate to its physical cause and world distribution. Avoid common shortcuts: deserts are not always hot, Mediterranean climates are not restricted to the Mediterranean Basin, and tropical monsoon circulation is not synonymous with the Am category.
Reading Köppen–Geiger Climate Regions
The metadata identifies a global Köppen–Geiger map for 1980–2016, directly relevant to climate classification. Köppen’s system is empirical: it groups climates using long-term temperature and precipitation patterns, with thresholds broadly linked to vegetation. Its main groups are A (tropical), B (dry), C (temperate), D (continental) and E (polar). Dry climates are identified through an aridity threshold that considers temperature and the seasonal distribution of rainfall, rather than through one universal annual rainfall cutoff.
Climate codes combine different kinds of information. In many A, C and D subtypes, letters describe precipitation seasonality; additional letters in C and D climates describe summer warmth or winter severity. India illustrates why a single label such as “monsoon climate” is insufficient: tropical wet and seasonally dry climates, arid and semi-arid regions, humid subtropical conditions and cold high-altitude climates occur within the country. Exact boundaries depend on the dataset, averaging period and classification implementation. This map represents a historical climatic baseline, not present-day weather or proof of a recent climatic shift.
- Decode letters within their group: BWh denotes hot desert and BSh hot steppe; h indicates temperature character, while W and S distinguish desert from steppe.
- Contrast approaches: Köppen emphasises observed temperature–precipitation regimes; Thornthwaite uses potential evapotranspiration and water balance. Genetic classifications instead emphasise climate-forming processes.
- For Indian applications, consider altitude, rain shadows and monsoon seasonality. A global borderless map cannot establish precise administrative boundaries or resolve every local mountain climate.
Real-world case studies
Western Ghats–Deccan contrast
Moist southwest monsoon winds ascend the Western Ghats, producing heavy windward rainfall. Descending air on the leeward side contributes to much drier conditions around parts of interior Maharashtra and Karnataka. The contrast helps explain why tropical wet climates and semiarid climates occur relatively close together. Orography modifies the regional monsoon signal.
The Atacama: an exceptional dry coastal climate
Northern Chile’s Atacama combines subtropical subsidence, the cold Humboldt Current and regional rain-shadow influences. Coastal fog can occur despite extremely low rainfall because a stable lower atmosphere restricts deep convection. It demonstrates that atmospheric moisture or fog does not necessarily imply a humid rainfall regime.
Previous year questions
No source-linked PYQ is available here yet. Use the practice questions below.
Practice questions
Practice MCQ 1
Consider the following statements about Köppen’s classification: 1. Every month in a Group A climate has a mean temperature of at least 18°C. 2. Every Group B climate has a mean annual temperature of at least 18°C. 3. Every Group E climate has a warmest-month mean temperature below 10°C. Which statements are correct?
- A. 1 and 2 only
- B. 1 and 3 only
- C. 2 and 3 only
- D. 1, 2 and 3
Practice MCQ 2
A station has a mean annual temperature of 20°C, receives 200 mm annual precipitation, and obtains 80% of its rainfall during the summer half-year. Using the Köppen–Geiger aridity formula, its climate is:
- A. BWh
- B. BSh
- C. BWk
- D. Aw
Practice MCQ 3
Which of the following best explains the characteristic precipitation seasonality of Mediterranean climates?
- A. Summer dominance of equatorial low pressure and winter dominance of polar easterlies
- B. Summer dominance of subtropical high pressure and winter influence of westerly disturbances
- C. Year-round dominance of the Intertropical Convergence Zone
- D. Summer snowfall followed by winter convection
Mains practice · Explain the basis of Köppen’s climate classification. How does Thornthwaite’s approach improve the interpretation of moisture availability? Illustrate with examples from India. Answer in 250 words.
- Introduce classification as the regionalisation of long-term climatic characteristics.
- Explain Köppen’s temperature, precipitation and seasonality criteria and its broad vegetation associations.
- Distinguish A, B, C, D and E; emphasise that dry climates require a temperature-adjusted rainfall threshold.
- Explain PET, soil-water storage, moisture surplus and moisture deficit in Thornthwaite’s approach.
- Use western Rajasthan, the Western Ghats, the leeward Deccan and northern plains as examples.
- Conclude with limitations involving averages, extreme events, local relief and changing climate boundaries.
Further reading
- NCERT, Fundamentals of Physical Geography, Class XI: World Climate and Climate Change.
- NCERT, India: Physical Environment, Class XI: Climate.
- World Meteorological Organization: Guidelines on the Calculation of Climate Normals, WMO-No. 1203.
- India Meteorological Department: Climatological Tables and climate publications, mausam.imd.gov.in.
- Thornthwaite, C. W. (1948), An Approach toward a Rational Classification of Climate, Geographical Review.
- Beck and colleagues (2018), Present and future Köppen–Geiger climate classification maps at 1-km resolution, Scientific Data.
- https://commons.wikimedia.org/wiki/File:K%C3%B6ppen-Geiger_Climate_Classification_Map_(1980%E2%80%932016)_no_borders.png
Preparing for UPSC Civil Services? Get classroom teaching, answer-writing evaluation and mentorship at Pragnya IAS Academy, Ashok Nagar — see why aspirants choose us for IAS coaching in Hyderabad.