
Core Sector Growth at 10.9%: Base Effects versus Infrastructure Momentum
Revise the static topic: UPSC Economy notes
In short: India’s core industries index grew by 10.9% in October 2026, the highest growth rate in the newly released series, according to the supplied report. Coal and electricity benefited substantially from weak year-earlier comparisons, while cement and iron ore showed stronger evidence of infrastructure-linked momentum; the headline alone does not establish a sustained industrial recovery.
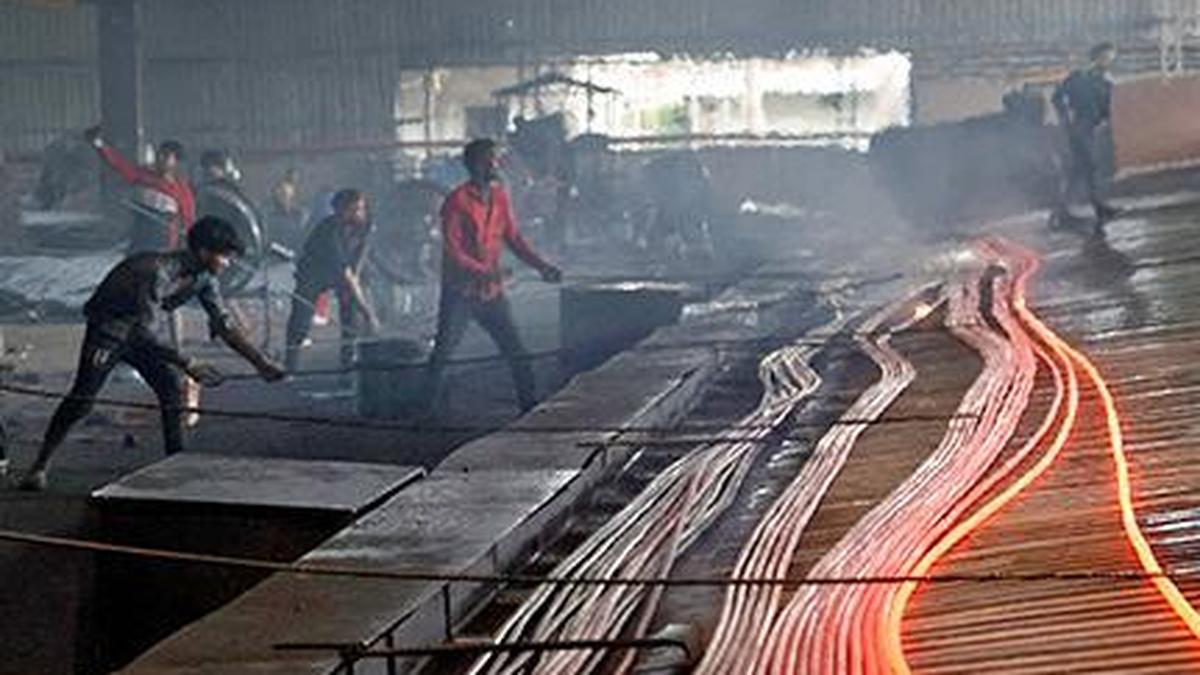
India’s reported core-sector growth of 10.9% in October 2026 reflects both weak year-earlier comparisons and infrastructure-linked momentum; the headline alone does not establish a sustained industrial recovery.
Image: The Hindu
Why in news
Data released by the Ministry of Commerce and Industry on November 20, 2026 showed core sector growth rising from 8.2% in September to 10.9% in October. The report attributes the acceleration to infrastructure-related production and a low base influenced by the festive calendar.
10.9%
October 2026 core growth
0.8%
October 2025 core growth
23.05%
Coal output growth
21.6%
Electricity generation growth
15.4%
Cement output growth
7.3%
Steel output growth
Background
The established Index of Eight Core Industries is a monthly production indicator compiled by the Office of the Economic Adviser under the Department for Promotion of Industry and Internal Trade, Ministry of Commerce and Industry. Its traditional constituents are coal, crude oil, natural gas, refinery products, fertilisers, steel, cement and electricity. These industries supply essential energy and intermediate inputs to the wider economy. The Index of Industrial Production, compiled by the National Statistical Office under the Ministry of Statistics and Programme Implementation, has broader coverage across mining, manufacturing and electricity. The supplied report describes a newly rebased core index and also reports iron ore within it; its complete revised composition and weights are not supplied.
What the headline establishes—and what it does not
Core sector growth reached 10.9% in October 2026, exceeding September’s 8.2%. However, October 2025 had recorded growth of only 0.8%, making the year-on-year comparison favourable.
The expression ‘series-high’ needs qualification. According to the report, the new index uses 2022-23 as its base year and its available data begin in April 2024. The October result is therefore the highest growth rate within this limited series, not an established all-time record for Indian industry.
- A higher growth rate does not necessarily mean that the absolute monthly addition to output is unusually large.
- Core sector growth is neither the overall IIP growth rate nor GDP growth.
- One strong monthly reading cannot establish the durability or breadth of industrial expansion.
Infographic
Headline
Highest growth in the reported new series, not an established all-time record.
Base effect
Coal and electricity benefited from year-earlier contractions.
Infrastructure signal
Cement and iron ore expanded against positive comparison bases.
Energy divergence
Crude oil and gas contracted; refinery products still grew.
Durability test
Check combined monthly performance, output levels and wider IIP trends.
AI-assisted infographic by Pragnya IAS Academy, based on the cited sources.
How a low base amplifies measured growth
Year-on-year growth measures the percentage change in output relative to the corresponding month of the previous year. When that comparison month was unusually weak, even a recovery towards normal production can generate a high growth rate. This statistical amplification is called a low base effect.
Coal output grew by 23.05% in October 2026 after contracting by 8.4% a year earlier. Electricity generation increased by 21.6% after a contraction of nearly 7% in October 2025. These are reported output increases, but their large percentage changes partly reflect weak comparison levels rather than an equivalent acceleration in underlying momentum.
The report links the weak comparison base to a shift in the festive calendar. Comparing October–November together, alongside output levels and suitably adjusted sequential movements, would provide a more reliable assessment than interpreting October in isolation.
- A base effect changes the interpretation of growth; it does not mean that the reported output increase is fictitious.
- Raw month-on-month comparisons can also be misleading when production is seasonal.
- The base year of an index and the comparison base used for year-on-year growth are different concepts.
Infrastructure momentum coexists with fuel-sector weakness
Cement and iron ore offer stronger evidence of underlying expansion because their growth accelerated despite positive growth in the corresponding year-earlier month. Cement grew by 15.4%, against 5.2% a year earlier, while iron ore grew by 23.4%, against 8.7%. Steel production increased by 7.3%, its fastest growth in seven months.
This pattern is consistent with stronger demand along infrastructure and construction supply chains. However, production data alone cannot determine how much demand came from public infrastructure spending, private construction, exports or inventory accumulation.
Energy-sector performance remained uneven. Crude oil output contracted by 4.1% and natural gas by 7.6%, while refinery products expanded by 3.4%. Thus, it would be inaccurate to describe all non-coal fuel sectors as contracting: refinery output grew, although its growth slowed.
- Crude oil production had contracted for 22 consecutive months, according to the report.
- Natural gas production had contracted for 28 consecutive months.
- Persistent upstream weakness warrants attention even when the aggregate index is strong.
Relationship with IIP and the rebasing caution
The core industries indicator provides an early reading of production in foundational sectors that also contribute to wider industrial activity. Higher coal supply can support power generation, while steel and cement output can signal construction-related demand. These linkages make core sector performance useful for assessing industrial conditions.
Nevertheless, the IIP covers a much wider range of products and industries. Its movement depends on the performance and weights of both core and non-core activities. A strong core reading can therefore coexist with weaker consumer-oriented or other manufacturing activity.
For examination purposes, distinguish the traditional eight-industry framework from the revised index described in the source. Iron ore is not a separate constituent of the traditional list, but the report includes it within the new index. Without the official revised methodology, neither the complete new constituent list nor revised weights should be inferred, and historical weights should not automatically be applied.
- Rebasing updates the reference framework of an index; interpretation also requires checking coverage and weights.
- A weighted aggregate can conceal contraction in individual industries.
- Cross-series comparisons require a consistent or officially linked series.
| Sector | Reported performance | Interpretation |
|---|---|---|
| Coal | Growth of 23.05%; contraction of 8.4% a year earlier | Output recovery with a favourable comparison base |
| Electricity | Growth of 21.6%; contraction of nearly 7% a year earlier | Strong increase, partly amplified by the low base |
| Cement | Growth of 15.4%; growth of 5.2% a year earlier | Stronger evidence of infrastructure-linked momentum |
| Iron ore | Growth of 23.4%; growth of 8.7% a year earlier | Expansion despite a positive comparison base; reported within the revised index |
| Steel | Growth of 7.3% | Fastest growth in seven months |
| Crude oil | Contraction of 4.1% | Persistent weakness in domestic upstream production |
| Natural gas | Contraction of 7.6% | Weakest performance in the reported new series |
| Refinery products | Growth of 3.4% | Slower expansion, not contraction |
- 1. Identify whether the headline measures year-on-year growth, sequential growth or an output level.
- 2. Examine the corresponding year-earlier month for contraction, disruption or festive-calendar effects.
- 3. Separate sectors growing against weak bases from those expanding against already positive bases.
- 4. Check output levels and performance across a broader period, including October–November.
- 5. Cross-check with wider IIP trends, project execution, orders and capacity utilisation before judging sustainability.
2022-23
Base year of the new core industries index described in the report.
April 2024
Beginning of the available data in the reported new series.
October 2025
Core growth was 0.8%, while coal and electricity output contracted, creating favourable comparisons for the following year.
September 2026
Core sector growth reached 8.2%, the previous high in the new series.
October 2026
Core sector growth accelerated to 10.9%, with divergent performance across industries.
November 20, 2026
The Ministry of Commerce and Industry released the reported data.
Significance, challenges & way forward
Significance
- Cement, steel and iron ore expansion provides a useful signal of activity in infrastructure-related supply chains.
- Coal and electricity growth indicates increased production in essential inputs for industrial activity.
- Sector-wise analysis reveals economic conditions more accurately than the aggregate headline alone.
- Correct interpretation of base effects improves forecasting and prevents exaggerated claims about industrial acceleration.
Challenges
- Festive-calendar shifts can distort comparisons between individual months.
- The short history of the reported new series limits the significance of record-growth claims.
- The source does not provide the revised index’s complete composition or weights, limiting contribution analysis.
- Persistent crude oil and natural gas contraction may heighten energy-security concerns if domestic demand remains strong.
- Production growth alone cannot establish final demand, employment gains or the source of investment.
Way forward
- Assess October and November together to reduce festive-calendar distortions, as suggested in the report.
- Publish and consult the revised methodology, constituent list, weights and any official linking arrangements before comparing series.
- Evaluate growth rates alongside output levels, longer-period trends and seasonally adjusted sequential indicators where available.
- Sustain efficient infrastructure investment through timely execution, maintenance and removal of project bottlenecks.
- Address upstream energy constraints through transparent regulation, appropriate investment and environmentally responsible production.
- Use broader manufacturing, investment and demand indicators to test whether core sector strength is spreading across the economy.
Key terms
- Index of Eight Core Industries
- The established monthly indicator tracking production in eight foundational energy and industrial sectors.
- Index of Industrial Production
- A broader index measuring changes in the volume of industrial production across mining, manufacturing and electricity.
- Low base effect
- An unusually weak comparison-period value that makes the current period’s percentage growth appear especially high.
- Year-on-year growth
- The percentage change relative to the corresponding period of the preceding year.
- Rebasing
- Updating an index’s reference base, often alongside revisions to its coverage and weighting structure.
- Series-high
- The highest observation within a specified statistical series, not necessarily an all-time historical record.
- Upstream energy production
- Exploration and extraction of primary energy resources such as crude oil and natural gas.
Link with static syllabus
Prelims practice MCQs
Q1. With reference to the traditional Index of Eight Core Industries, consider the following statements: 1. Fertilisers and refinery products are constituents. 2. Iron ore is a separate constituent. 3. Electricity is a constituent. Which of the statements given above are correct?
Q2. Consider the following statements about a low base effect: 1. It can amplify year-on-year growth following an unusually weak comparison month. 2. It proves that current output has not increased. 3. A shift in the festive calendar can affect year-on-year monthly comparisons. Which of the statements given above are correct?
Q3. Which of the following best describes the relationship between core industries growth and the Index of Industrial Production?
Q4. With reference to the October 2026 figures in the supplied report, consider the following statements: 1. Crude oil and natural gas production contracted. 2. Refinery products output contracted. 3. Cement growth accelerated despite positive growth in the corresponding year-earlier month. Which of the statements given above are correct?
Mains practice questions
GS 3 · 15 marks · 250 words
A sharp rise in core sector growth need not imply a sustained industrial recovery. Examine with reference to base effects, sectoral divergence and the relationship between core industries and IIP.
Frequently asked questions
Does a low base effect mean that core sector growth is not real?
No. Output can genuinely increase, while the percentage growth rate is amplified by an unusually weak year-earlier comparison.
Is core sector growth the same as IIP growth?
No. Core industries cover foundational sectors, whereas IIP measures a broader industrial basket; their growth rates depend on different coverage and weights.
Why is October–November performance more useful than October alone?
Examining the two months together can reduce distortions caused by shifts in the festive calendar. It should still be supplemented with output levels and broader industrial indicators.
Can the revised index be treated as identical to the traditional eight-industry index?
Not without checking its methodology. The report includes iron ore within the revised index but does not provide the complete constituent list or weights.
Sources
- The Hindu: Infra push and low base effect pushes core sector growth to series-high of 10.9% in October 2026
Analysis prepared by the Pragnya IAS Academy current-affairs desk with AI assistance from the cited reports. Verify figures with the original sources.
Turn current affairs into marks
Join Pragnya IAS Academy's mentorship for daily answer-writing evaluation on stories like this — classroom programmes from a trusted name in IAS coaching in Hyderabad.