
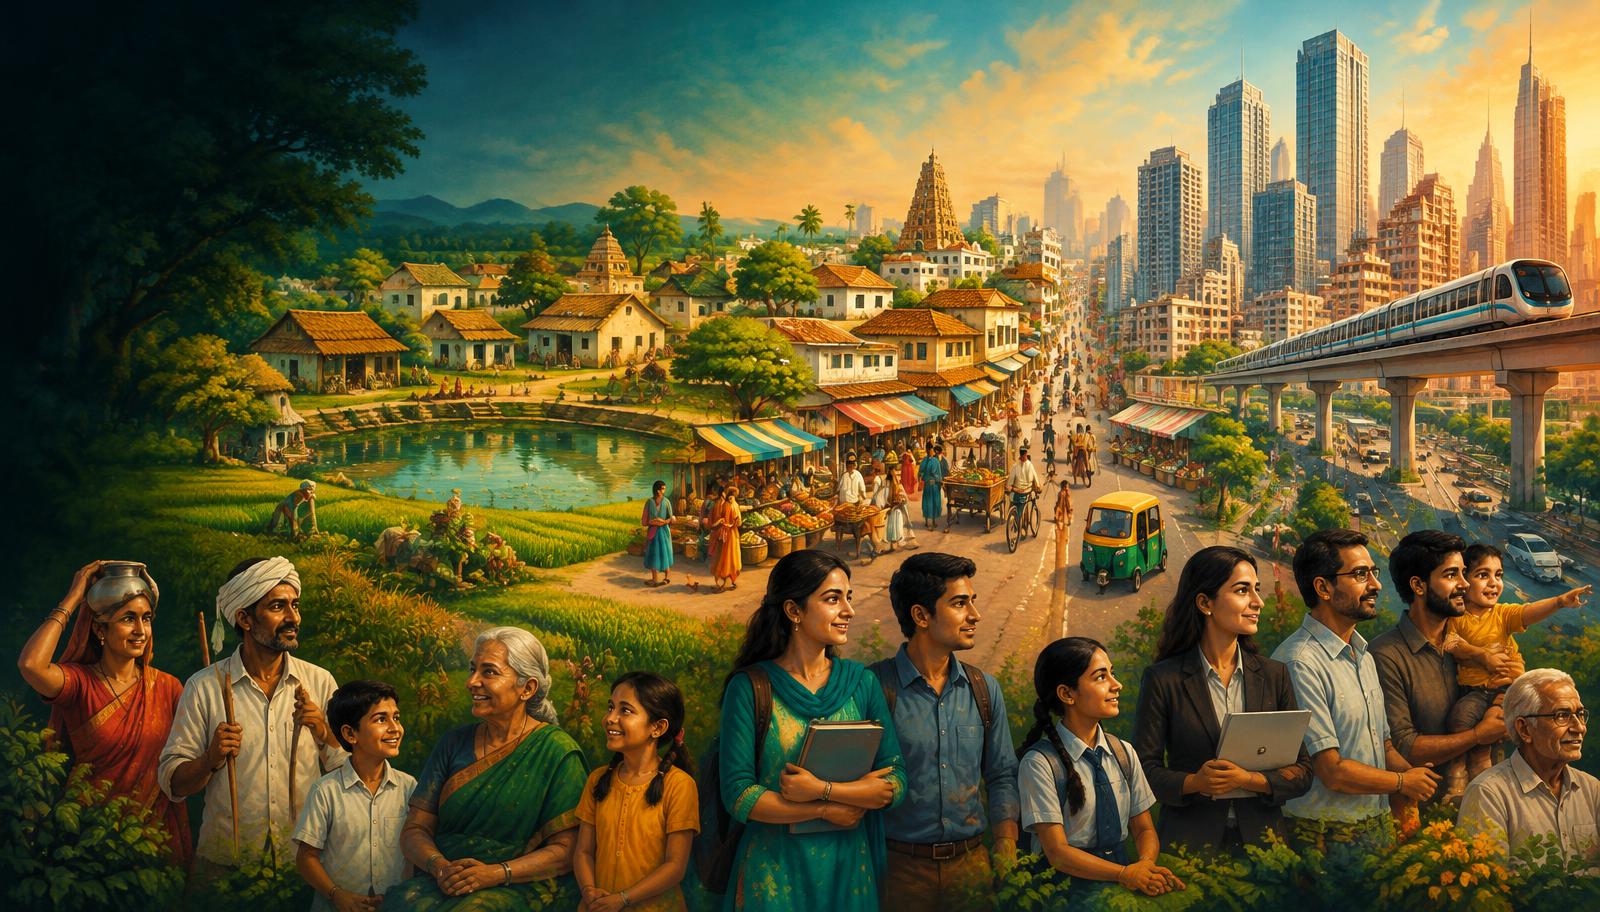
InfoGraphix by Pragnya · Geography · Chapter 22
Population and Settlements
Read India’s population through dated census benchmarks, demographic change and migration. Connect rural forms and urban growth with inclusive, resilient public policy.
- 18 visual topics
- 54 practice MCQs
- 54 flip cards
Three ways to read the population
Topics 1–6
Measure the population
Census institutions, updated scheduling, benchmarks, distribution, density and growth.
Topics 7–12
Understand demographic change
Fertility, gender, education, ageing, occupations and migration.
Topics 13–18
Plan human settlements
Village forms, urban definitions, city growth, missions and integrated revision.
Benchmarks, transitions and policy milestones
Scroll the ribbon and tap any milestone to open its infographic.
1872–1881
Enumeration begins
Non-synchronous beginnings lead to synchronous censuses.
Open topic →1921
Great Divide
Growth shifts away from near-stagnation.
Open topic →1951–1981
Rapid expansion
Mortality declines faster than fertility.
Open topic →2000
Population policy
Voluntary reproductive health and stabilisation goals.
Open topic →2011
Benchmark census
Counts anchor spatial and social comparisons.
Open topic →2015
Urban missions
Smart Cities and AMRUT target different urban needs.
Open topic →2019–2021
NFHS-5
National TFR estimated at 2.0.
Open topic →2023
Global rank and ageing
UN estimates place India first; ageing requires preparation.
Open topic →2026–2027
Announced census cycle
Digital design and caste enumeration; do not invent new results.
Open topic →
Topic index
Follow the numbers in order, or jump to what you need.
0 of 18 revised on this device
- 1Population
Census: Scope, Law and Institutions
Enumeration, dates and data sources
An Indian census is a complete population enumeration, not a sample survey. Its benchmark counts support planning, while surveys and population projections answer different questions between censuses.
Open infographic - 2Population
Census 2027 and India’s Global Rank
Announced schedule, not new results
Census 2011 remains the latest completed population census. The postponed 2021 round must not be relabelled as a completed count; Census 2027 is the announced successor, while India’s 2023 global population rank comes from UN estimates.
Open infographic - 3Population
Census 2011: The Core Dashboard
Benchmark numbers and state boundaries
The 2011 census provides the common benchmark for population, density and social composition. Use final figures consistently and interpret state comparisons on the administrative map that existed in 2011.
Open infographic - 4Population
Where Indians Live
Water, relief, livelihoods and history
Population distribution describes where people live; it is not identical to population density. India’s crowded plains and metropolitan corridors reflect the interaction of water, cultivable land, jobs and accumulated infrastructure.
Open infographic - 5Population
Density: Measures and Rankings
Arithmetic, physiological and agricultural
Density expresses population relative to an area, but the denominator determines the interpretation. National arithmetic density conceals large differences in cultivable land, local crowding and ecological pressure.
Open infographic - 6Population
Population Growth and Demographic Transition
Four Indian phases and the growth equation
Population changes through births, deaths and net migration; natural increase counts only births minus deaths. India’s historical growth phases illustrate demographic transition, but regions do not move through it at the same pace.
Open infographic - 7Population
Fertility, Momentum and Population Policy
NFHS-5, replacement and NPP 2000
Total fertility rate estimates the children a woman would bear under current age-specific fertility rates. Below-replacement fertility does not produce instant population decline because age structure and improved survival generate momentum.
Open infographic - 8Population
Sex Ratio, Child Sex Ratio and Literacy
Definitions before comparisons
Population composition indicators reveal unequal survival and access to education. Always identify the age group, denominator, source and release before comparing sex ratios or literacy levels.
Open infographic - 9Population
Age Structure, Dividend and Ageing
A window requiring jobs and care
A rising working-age share can create a demographic dividend only when people are healthy, skilled and productively employed. India’s regional age differences connect labour mobility, social spending and future representation debates.
Open infographic - 10Population
Workforce and Social Composition
Occupations, languages and communities
Composition includes livelihoods, language and social identity as well as age and sex. Census categories describe population characteristics; they do not establish a hierarchy of communities or measure all dimensions of inequality.
Open infographic - 11Population
Migration: Measures, Streams and Causes
Residence changes, push and pull
Migration involves a change of usual residence; commuting does not automatically count as migration. Census stocks by birthplace and by last residence differ and must be labelled before comparing totals or reasons.
Open infographic - 12Population
Migration: Consequences and Portable Welfare
Remittances, gender and worker security
Migration links labour-surplus regions with job centres and can improve household incomes through remittances. Benefits coexist with insecure work, exclusion from services and care burdens on families left behind.
Open infographic - 13Settlements
Rural Settlements: Four Types
Compact, fragmented, hamleted, dispersed
Rural settlement type describes the grouping and spacing of houses rather than their geometric outline. Water access, terrain, security, landholding and social relations can all shape the resulting village fabric.
Open infographic - 14Settlements
Village Patterns, Sites and Situations
Linear, circular, radial and grid-like
Settlement pattern describes the visible arrangement of houses and streets. Site refers to the occupied ground itself; situation refers to relationships with surrounding routes, markets and landscapes.
Open infographic - 15Urbanisation
Urban Definitions and Size Hierarchy
Statutory towns, census towns and UAs
Indian census urban status combines legal recognition with statistical criteria. A settlement can be economically urban without a municipal government, while an urban agglomeration extends beyond a single municipal boundary.
Open infographic - 16Urbanisation
Urban Growth, Functions and Risks
Growth sources and inclusive planning
Urbanisation is a rising share of people living in urban places, not merely larger city populations. India’s urban growth combines natural increase, migration and changes in classification or boundaries.
Open infographic - 17Urbanisation
Urban Missions: Smart Cities and AMRUT
Infrastructure, housing and local capacity
Urban missions address different service gaps and should not be treated as interchangeable labels. Sustainable outcomes require municipal finance, local capacity and inclusive maintenance as well as capital projects.
Open infographic - 18Revision
Chapter Quick Revision
Benchmarks, traps and a Mains structure
Revise population through three linked questions: how it is measured, how its structure changes and how settlements are governed. Anchor static comparisons in Census 2011 and label every survey, estimate and announced future operation.
Open infographic
Full reading notes in the Study Library
- Census concepts →
- Population distribution →
- Northern Plains →
- Population density →
- Demographic dividend →
- Migration →
- Floods →
- Urbanisation →