
Core-Sector Growth at 10.9%: Infrastructure Momentum versus Base Effects
Revise the static topic: UPSC Economy notes
In short: Core industrial output grew 10.9% year-on-year in October 2026, the highest rate in the new series, supported by infrastructure-linked production and a weak comparison base. Strong cement, steel and iron ore output indicates underlying momentum, but coal and electricity growth was amplified by base effects, while crude oil and natural gas production continued to contract.
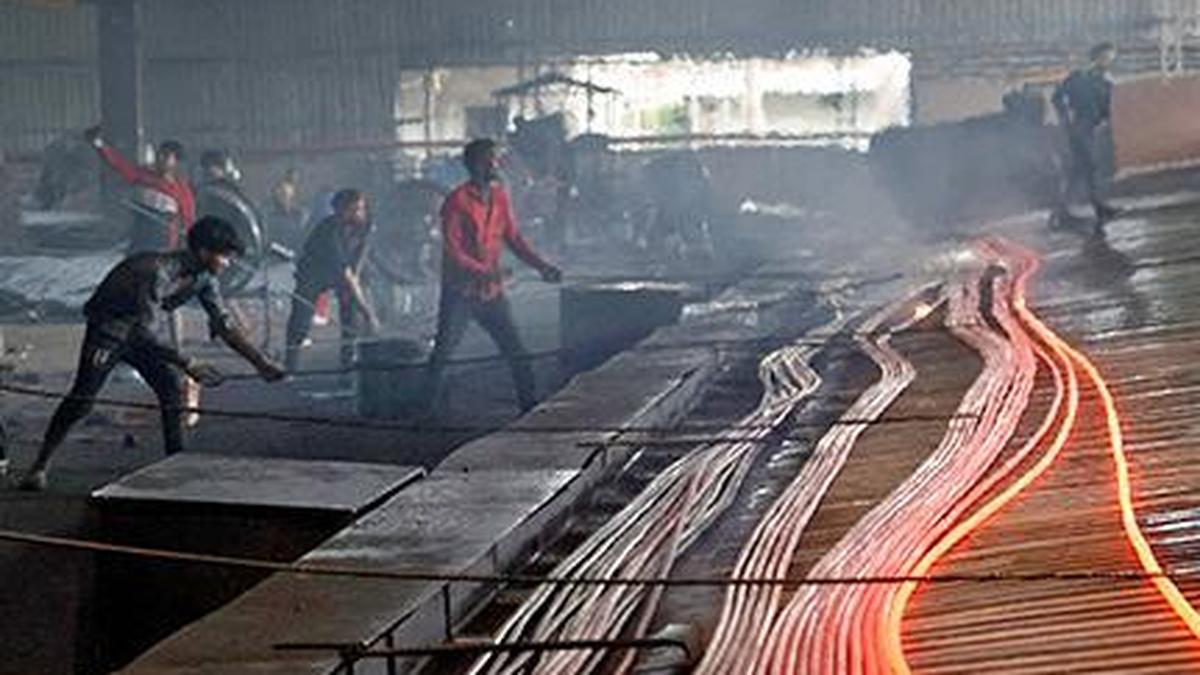
Core-sector output grew 10.9% year-on-year in October 2026, reflecting infrastructure-linked production strength and a weak comparison base.
Image: The Hindu
Why in news
Ministry of Commerce and Industry data released on November 20, 2026 showed core-sector growth accelerating from 8.2% in September to 10.9% in October. The figures require careful interpretation because the revised series has a short history and festive-calendar shifts affected the year-earlier comparison.
10.9%
October 2026 core-sector growth
0.8%
October 2025 comparison-base growth
23.05%
October coal growth
21.6%
October electricity growth
15.4%
October cement growth
-7.6%
October natural gas growth
Background
The Index of Eight Core Industries has traditionally tracked production in coal, crude oil, natural gas, refinery products, fertilisers, steel, cement and electricity. Compiled by the Office of the Economic Adviser under the Department for Promotion of Industry and Internal Trade, Ministry of Commerce and Industry, it is a weighted production indicator for foundational industrial inputs and has an important relationship with the broader Index of Industrial Production. The supplied report describes a revised Index of Core Industries with base year 2022-23 and includes iron ore in its sectoral discussion. Since it does not provide the revised basket or weights, the traditional eight-sector composition should not automatically be treated as the composition of the new series.
What the October figures establish
Core-sector growth rose to 10.9% in October 2026 from 8.2% in September. This is a year-on-year increase: it compares output with October of the previous year, not with September 2026.
The reported series high applies only to the new series, whose data extend back to April 2024. It is therefore not evidence of an all-time industrial growth record, nor does it establish equivalent growth in manufacturing or GDP.
- Cement production grew 15.4%, compared with 10.1% in September.
- Steel production grew 7.3%, its fastest rate in seven months.
- Iron ore production grew 23.4%, compared with 18.4% in September.
- Crude oil and natural gas contracted, while refinery products continued to grow at a slower pace.
Infographic
Headline
10.9% annual growth; highest in the revised series.
Base effect
Weak year-earlier coal and electricity output amplified growth.
Real strength
Cement, steel and iron ore indicate infrastructure-linked momentum.
Weak spots
Crude oil and natural gas contracted; refining growth slowed.
Better assessment
Check multi-month output, calendar effects and revised methodology.
AI-assisted infographic by Pragnya IAS Academy, based on the cited sources.
Understanding the index: production, weights and rebasing
A core industries index combines sectoral production indicators using assigned weights. Consequently, aggregate growth is not a simple arithmetic average of sectoral growth rates; the influence of each sector depends on its weight and index movement. It measures production rather than prices, company profits or value added across the entire economy.
Rebasing updates the reference framework used to measure production and may involve changes in weights, coverage or methodology. According to the source, the new index uses 2022-23 as its base year. Comparisons with an older series require an official methodological bridge rather than directly joining growth records.
- The index base year is the reference period for constructing the index; the comparison base for October year-on-year growth is the previous October.
- The source does not disclose the complete revised basket or sectoral weights, so precise sectoral contributions cannot be calculated from it.
- Iron ore appears in the revised-series reporting, but the source does not establish whether it was added, substituted or otherwise incorporated.
Base effects versus underlying output momentum
Year-on-year growth equals the change in output from the corresponding year-earlier period divided by that earlier period's output, multiplied by a hundred. A depressed denominator can produce a large growth rate even when current output is not accelerating sharply. October's aggregate growth followed a weak 0.8% increase in October 2025.
Coal growth accelerated to 23.05%, against an 8.4% contraction a year earlier. Electricity grew 21.6%, following a contraction of nearly 7% in October 2025. These increases represent higher output than a year earlier, but their magnitude was amplified by the weak base; base effects do not mean that no actual output growth occurred.
Festive-calendar shifts can redistribute working days and production between adjacent months. The report therefore cites an assessment that October-November performance would provide a better reading. Analysts should examine the combined period alongside output levels and seasonally adjusted sequential indicators, where available.
- A higher year-on-year growth rate does not by itself establish higher month-on-month output.
- Comparison over a longer horizon can help distinguish recovery from a depressed base from sustained expansion.
- A single strong month should be checked against subsequent production, demand and investment indicators.
Infrastructure strength coexists with fuel-sector weakness
The infrastructure-linked sectors provide stronger evidence of underlying momentum. Cement expanded 15.4% after 5.2% growth a year earlier, while iron ore grew 23.4% after 8.7% growth. Alongside stronger steel output, this pattern is consistent with infrastructure-led demand rather than merely recovery from a year-earlier contraction.
Energy performance was uneven. Crude oil production contracted 4.1%, extending its contraction to 22 consecutive months. Natural gas declined 7.6%, its weakest performance in the new series, and contracted for 28 consecutive months. Refinery products grew 3.4%, a slowdown rather than a contraction.
The figures suggest a possible demand linkage between electricity generation and coal production, while sustained weakness in domestic hydrocarbons raises energy-security concerns. However, the source does not identify the causes of the oil and gas decline or establish how much infrastructure spending contributed to aggregate growth.
- Strong construction-material output is a positive signal, but it does not establish a broad-based industrial recovery.
- Refining growth can coexist with falling domestic crude production because refineries can process imported crude.
- Persistent hydrocarbon contraction warrants diagnosis rather than an unsupported attribution to any single policy or geological factor.
| Indicator | Source-reported performance | Interpretation |
|---|---|---|
| Aggregate core output | 10.9%; year-earlier growth was 0.8% | Strong annual growth, amplified by a weak comparison base |
| Coal | 23.05%; year-earlier contraction was 8.4% | Recovery with a substantial favourable base effect |
| Electricity | 21.6%; year-earlier contraction was nearly 7% | Higher generation, with growth amplified by the base |
| Cement and iron ore | 15.4% and 23.4%, respectively | Strong expansion despite positive year-earlier growth |
| Crude oil and natural gas | Contractions of 4.1% and 7.6%, respectively | Persistent weakness in domestic hydrocarbon production |
| Refinery products | Growth of 3.4% | Slower expansion, not an output contraction |
- 1. Identify the comparison: year-on-year growth is not sequential output growth.
- 2. Check whether the year-earlier output level was unusually weak.
- 3. Disaggregate sectors and examine their weights before assessing contributions.
- 4. Compare output levels and performance across adjacent months to reduce calendar distortions.
- 5. Cross-check the signal with broader industrial production and demand indicators.
2022-23
Base year of the revised core industries index described in the source.
April 2024
Earliest period covered by the new series, according to the report.
October 2025
Aggregate core-sector growth was 0.8%, while coal and electricity contracted.
September 2026
Core-sector growth reached 8.2%, the previous high in the new series.
October 2026
Growth accelerated to 10.9%, with infrastructure-linked strength and favourable base effects.
November 20, 2026
The Ministry of Commerce and Industry released the reported figures.
Significance, challenges & way forward
Significance
- Strong cement, steel and iron ore production is consistent with infrastructure demand supporting upstream industrial activity.
- Higher coal production and electricity generation indicate expanding energy supply relative to the year-earlier period.
- Sectoral divergence shows why an aggregate index must be read alongside its components.
- The revised series makes methodological clarity essential for interpreting records and historical comparisons.
Challenges
- Weak year-earlier output and festive-calendar shifts can exaggerate the apparent acceleration in annual growth.
- The short history of the revised series limits claims about long-term records.
- Persistent crude oil and natural gas contraction raises concerns about domestic energy supply and potential import exposure.
- Strong infrastructure-linked output alone cannot establish a broad-based recovery in industrial demand.
- The supplied report lacks revised weights, complete coverage details and sequential output data needed for a fuller assessment.
Way forward
- Assess October-November performance together and use seasonally adjusted sequential indicators where available.
- Present output levels, year-on-year growth and longer-horizon comparisons together to distinguish recovery from sustained momentum.
- Use official technical documentation to establish the revised basket, weights and comparability with the earlier series.
- Sustain productive infrastructure investment while monitoring project execution, demand durability and fiscal sustainability.
- Diagnose persistent oil and gas production weakness through field-level and operational evidence before prescribing corrective measures.
- Strengthen energy efficiency, supply diversification and cleaner energy development alongside measures to improve reliable domestic supply.
Key terms
- Index of Eight Core Industries
- The traditional weighted production index covering coal, crude oil, natural gas, refinery products, fertilisers, steel, cement and electricity.
- Base effect
- The influence of an unusually high or low comparison-period value on the current growth rate.
- Year-on-year growth
- The percentage change relative to the corresponding period of the previous year.
- Sequential momentum
- The movement in output relative to the immediately preceding period, preferably adjusted for seasonal and calendar effects.
- Rebasing
- Updating an index's reference year, potentially alongside revisions to weights, coverage or methodology.
- Series high
- The highest observation within a specified statistical series, not necessarily an all-time historical record.
- Growth deceleration
- A decline in the rate of expansion while output may still remain above the comparison-period level.
Link with static syllabus
Prelims practice MCQs
Q1. With reference to interpreting core-sector growth, consider the following statements: 1. A low year-earlier output level can amplify the current year-on-year growth rate. 2. A higher year-on-year growth rate necessarily establishes an increase in output over the immediately preceding month. 3. Positive year-on-year growth can coexist with a sequential decline in output. Which of the statements given above are correct?
Q2. Which of the following groups contains only sectors in the traditional Index of Eight Core Industries?
Q3. With reference to the October 2026 core-sector data in the supplied report, consider the following statements: 1. Both crude oil and natural gas production contracted. 2. Refinery products recorded positive but slower growth. 3. Coal's strong growth followed a contraction in the corresponding year-earlier month. Which of the statements given above are correct?
Q4. Consider the following statements about a rebased production index: 1. Its index base year and the comparison period for year-on-year growth are necessarily identical. 2. A series high in a short revised series need not be an all-time historical high. 3. Sectoral weights are necessary for properly assessing the contribution of individual sectors to aggregate growth. Which of the statements given above are correct?
Mains practice questions
GS 3 · 15 marks · 250 words
A sharp rise in core-sector growth need not imply a broad-based acceleration in industrial activity. Discuss with reference to the October 2026 figures.
Frequently asked questions
Does 10.9% growth mean core output increased by that amount over September?
No. It is a year-on-year comparison with October 2025, not a month-on-month comparison with September 2026.
Does a favourable base effect mean that output did not actually grow?
No. Output can genuinely increase over the year while a weak comparison base amplifies the reported percentage growth; the rate alone does not establish strong sequential momentum.
Is the reported 10.9% an all-time record?
The source identifies it as the highest growth rate in the revised series, which extends back only to April 2024. It should not be presented as an all-time historical record.
How should iron ore's inclusion in the report be understood?
The report discusses iron ore within the revised index, whereas the traditional eight-sector basket does not include it. The complete revised composition and weights must be checked in official technical documentation rather than inferred from the article.
Sources
- The Hindu: Infra push and low base effect pushes core sector growth to series-high of 10.9% in October 2026
Analysis prepared by the Pragnya IAS Academy current-affairs desk with AI assistance from the cited reports. Verify figures with the original sources.
Turn current affairs into marks
Join Pragnya IAS Academy's mentorship for daily answer-writing evaluation on stories like this — classroom programmes from a trusted name in IAS coaching in Hyderabad.