
WWF Living Planet Report: What the 73% Wildlife Population Decline Means
Revise the static topic: UPSC Environment notes
In short: According to the supplied Indian Express report on WWF’s Living Planet Report 2026, monitored vertebrate population sizes declined by an average of 73% between 1970 and 2022. This measures changes in relative abundance, not the percentage of animals lost or species becoming extinct, and highlights the need to address habitat degradation and unsustainable production and consumption.
Why in news
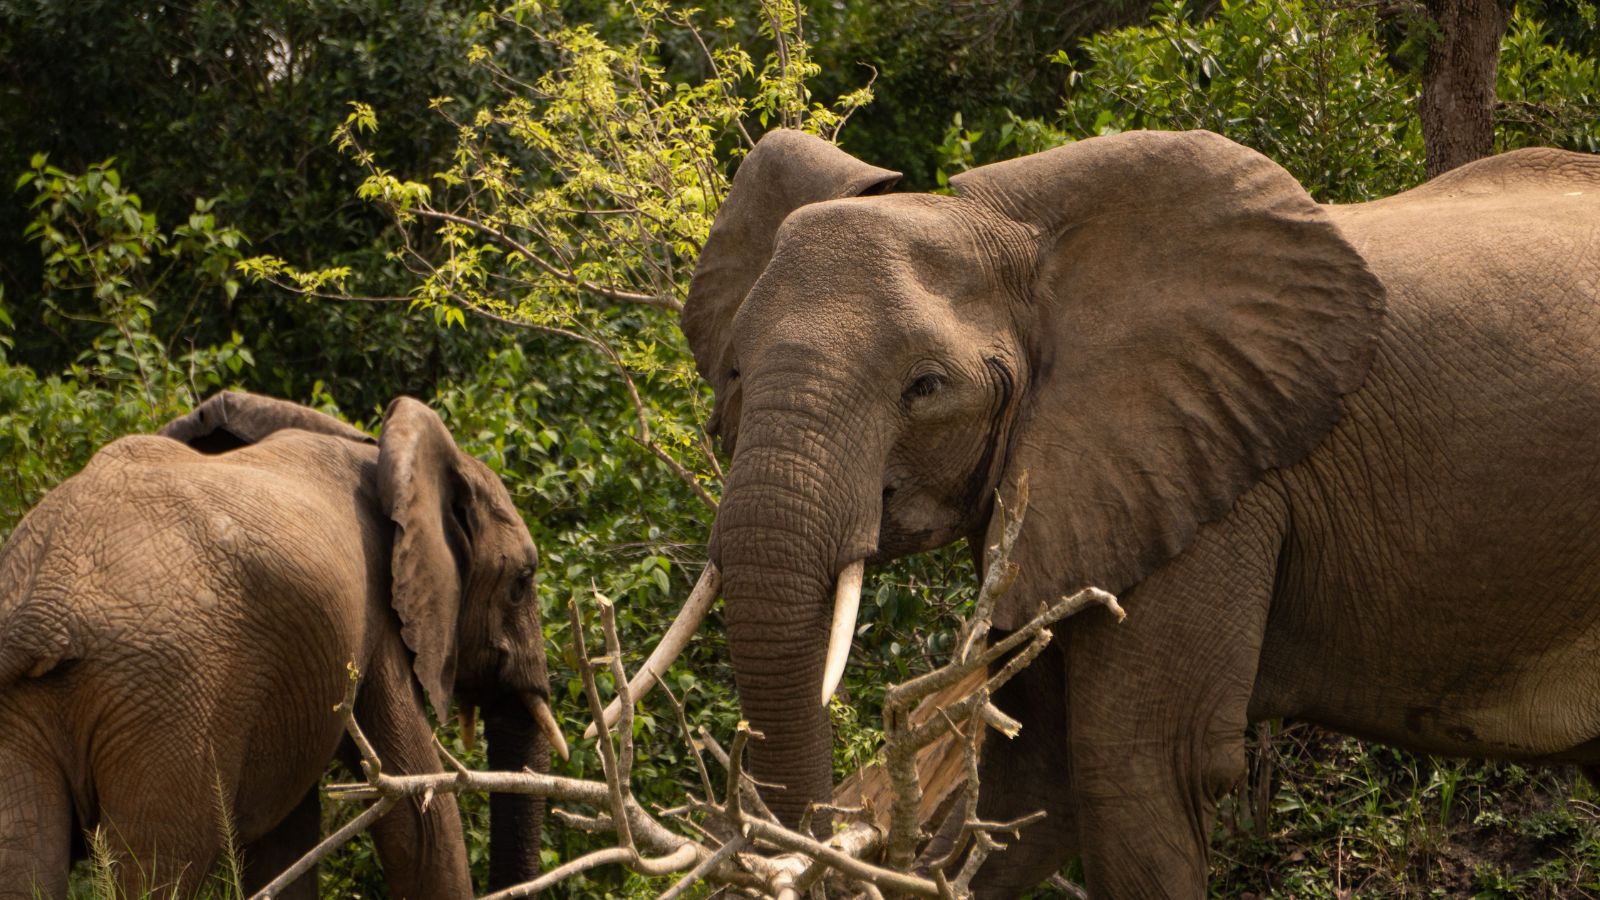
WWF’s biennial Living Planet Report, as reported by The Indian Express, flags a substantial decline in monitored wildlife populations, with freshwater ecosystems recording the steepest fall. It also highlights recoveries showing that sustained, targeted conservation can reverse population declines.
73%
Average monitored population decline
85%
Freshwater population decline
69%
Terrestrial population decline
59%
Marine population decline
35,803
Population trends included
5,790
Vertebrate species covered
Background
Biodiversity encompasses diversity within species, between species and across ecosystems. A population is a group of individuals of the same species occupying a particular area; a species can therefore have several distinct populations. The Living Planet Index, produced by the Zoological Society of London and featured in WWF’s Living Planet Report, tracks changes in the relative abundance of monitored wild vertebrate populations. It complements, rather than replaces, assessments of extinction risk, habitat condition and ecosystem functioning.
What the Living Planet Index measures
The reported assessment covers 35,803 population trends belonging to 5,790 vertebrate species between 1970 and 2022. Its central measure is change in population size relative to a baseline, rather than a census of all individual animals worldwide.
The headline decline must therefore be read as an aggregate indicator of monitored population trends. It does not establish that every monitored population declined by the same amount, nor that the finding applies identically to every species or region.
- The index measures relative abundance over time, not the absolute number of animals lost.
- Its vertebrate coverage does not constitute a direct assessment of all plants, fungi or invertebrates.
- WWF states that half of the included populations are stable or increasing, despite the negative overall trend.
Infographic
Measure
73% average decline in monitored population sizes, not an animal-loss census.
Distinction
Population decline is not the same as species extinction.
Priority ecosystem
Freshwater shows the steepest reported decline.
Systemic driver
Food production and consumption exert major biodiversity pressures.
Response
Combine habitat protection with food, energy and finance reform.
Recovery
Targeted, sustained conservation can reverse population declines.
AI-assisted infographic by Pragnya IAS Academy, based on the cited sources.
Population decline is not species extinction
Population decline means that a monitored group has become smaller. Local extinction means that a species has disappeared from a particular area, while global extinction means that no living individuals of that species remain anywhere.
A species may survive globally even as many of its populations shrink. Such declines still matter because reduced abundance can weaken ecological functions, diminish genetic diversity and increase vulnerability to future disturbances.
- The 73% figure is not the share of vertebrate species that have become extinct.
- It is not the share of monitored populations that have disappeared.
- Population trends and extinction-risk assessments answer different, complementary conservation questions.
Drivers of decline and ecosystem differences
The source reports the strongest decline in freshwater ecosystems at 85%, followed by terrestrial ecosystems at 69% and marine ecosystems at 59%. These are ecosystem-specific population indicators, not percentages of habitat area destroyed.
The report identifies habitat loss and degradation, overexploitation, climate change, invasive species, pollution and disease as dominant drivers. It describes how food is produced and consumed as the single largest driver of biodiversity loss, linking food systems to habitat destruction, overharvesting and greenhouse gas emissions.
- Freshwater conservation requires attention to entire river basins, including water quality, flows, wetlands and ecological connectivity.
- Terrestrial conservation must address habitat conversion and fragmentation beyond protected-area boundaries.
- Marine conservation requires sustainable harvesting alongside habitat protection and pollution control.
Conservation implications for India
The report cites recoveries involving green turtles, bluefin tuna, tigers and southern African elephants as evidence that targeted interventions can work. It reports an increase in global wild tiger numbers from 3,200 in 2010 to around 5,700 in 2025; these are global figures, not India-only estimates.
For India, the policy lesson is to combine species protection with ecosystem restoration and changes in economic incentives. The constitutional commitment to environmental protection, the Wild Life (Protection) Act and the Biological Diversity Act provide important foundations, but conservation outcomes also depend on land-use decisions, community participation and effective implementation.
The report’s emphasis on positive tipping points in food, energy and finance systems suggests that conservation cannot remain confined to wildlife departments. Agricultural policy, infrastructure planning and financial decisions must also account for biodiversity impacts.
- Treat species recoveries as evidence of what sustained action can achieve, not as proof that the wider biodiversity crisis has ended.
- Use national and local monitoring to identify priorities rather than treating the global decline as an India-specific estimate.
- Protect corridors, catchments and community-managed habitats alongside formally protected areas.
| Concept | Meaning and interpretation |
|---|---|
| Relative population abundance | Change in the size of a monitored population compared with a baseline; central to the LPI. |
| Absolute animal loss | The actual number of individual animals lost; not supplied by the headline LPI decline. |
| Local extinction | Disappearance of a species from a particular area while it may survive elsewhere. |
| Global species extinction | Loss of all living individuals of a species worldwide; not measured by the headline LPI decline. |
| Extinction risk | An assessment of vulnerability to extinction using multiple criteria; distinct from an aggregate population trend. |
- 1. Unsustainable production and consumption increase demand for land, water and biological resources.
- 2. Habitat conversion, overharvesting, pollution and other pressures alter ecosystems.
- 3. Affected wildlife populations decline in abundance or become fragmented.
- 4. Ecological functions weaken and vulnerable populations face greater risks of local disappearance.
- 5. Habitat restoration, sustainable resource use and sustained protection can enable recovery.
1970
Beginning of the population-trend assessment period reported in the source.
2010
Global wild tiger numbers stood at 3,200 according to the report’s recovery example.
2022
Endpoint of the reported Living Planet Index assessment period.
2025
Global wild tiger numbers reached around 5,700 according to the report.
2026
The supplied Indian Express account attributes the findings to WWF’s Living Planet Report 2026.
Significance, challenges & way forward
Significance
- Population monitoring can reveal ecological deterioration before a species becomes globally extinct.
- The freshwater finding highlights the need to integrate biodiversity into water governance and river-basin planning.
- The food-system link places biodiversity conservation within agricultural and economic policy, not merely protected-area management.
- Documented recoveries demonstrate that sustained conservation action can deliver results despite an adverse global trend.
Challenges
- Misreading the headline as the loss of individual animals or species can distort public understanding and policy priorities.
- An aggregate index can obscure differences between declining, stable and recovering populations.
- Vertebrate population trends cannot alone capture the full condition of biodiversity across all biological groups.
- Conservation objectives can conflict with short-term incentives for habitat conversion and intensive resource extraction.
- Recovery examples cannot automatically be generalised across species or ecosystems with different ecological and governance conditions.
Way forward
- Communicate the index’s scope and limitations alongside every headline figure.
- Combine population trends with habitat condition, extinction-risk assessments and monitoring of other biological groups.
- Prioritise freshwater restoration through pollution control, ecological flows and protection of wetlands and catchments.
- Reduce food-system pressures through sustainable farming, responsible harvesting and reduced food loss and waste.
- Integrate biodiversity safeguards into infrastructure, energy and financial decisions rather than relying only on protected areas.
- Support community participation and long-term monitoring so that conservation measures are locally legitimate and adapt to evidence.
Key terms
- Living Planet Index
- An indicator tracking average changes in the relative abundance of monitored wild vertebrate populations over time.
- Relative abundance
- Population size expressed in relation to a reference level rather than as an absolute count.
- Population
- A group of individuals of the same species occupying a particular area.
- Extirpation
- Local disappearance of a species from an area while it continues to exist elsewhere.
- Species extinction
- The disappearance of all living individuals of a species worldwide.
- Positive tipping point
- A threshold beyond which reinforcing changes can accelerate a beneficial transition, such as towards nature-positive systems.
- Ecological connectivity
- The ability of organisms and ecological processes to move or operate across connected habitats.
Link with static syllabus
Prelims practice MCQs
Q1. With reference to the Living Planet Index, consider the following statements: 1. It tracks changes in the relative abundance of monitored wild vertebrate populations. 2. Its headline decline directly measures the proportion of species that have become extinct. 3. It is produced by the Zoological Society of London. Which of the statements given above are correct?
Q2. According to the supplied account of WWF’s Living Planet Report, which is the correct descending order of reported population declines across ecosystems?
Q3. Consider the following pairs: 1. Extirpation: Disappearance of a species from a particular area 2. Global extinction: Survival of a species only outside its original habitat 3. Relative abundance: Population size considered in relation to a reference level Which of the pairs given above are correctly matched?
Q4. With reference to interpreting wildlife population indicators, consider the following statements: 1. A negative aggregate population trend can coexist with stable or increasing individual populations. 2. A global population-decline indicator establishes an identical decline for India. 3. Recoveries of selected species establish that biodiversity has recovered across all ecosystems. Which of the statements given above is/are correct?
Mains practice questions
GS 3 · 15 marks · 250 words
Distinguish wildlife population decline from species extinction. In light of WWF’s reported findings, examine why biodiversity conservation requires action beyond protected areas.
Frequently asked questions
Does the reported 73% decline mean that 73% of wild animals have disappeared?
No. It describes average changes in the relative size of monitored vertebrate populations, not an absolute count of individual animals lost.
Does the Living Planet Index measure species extinction?
No. It measures population trends; species extinction and extinction risk require different assessments.
Which ecosystem recorded the steepest reported decline?
Freshwater ecosystems recorded the largest reported decline at 85%, followed by terrestrial ecosystems at 69% and marine ecosystems at 59%.
How can the overall index decline when some populations are recovering?
An aggregate trend reflects differing population trajectories, so substantial declines can outweigh stable or increasing trends. WWF states that half of the populations included are stable or increasing.
Sources
Analysis prepared by the Pragnya IAS Academy current-affairs desk with AI assistance from the cited reports. Verify figures with the original sources.
Turn current affairs into marks
Join Pragnya IAS Academy's mentorship for daily answer-writing evaluation on stories like this.