
Delhi Pollution: PM2.5 Data Gaps, AQI Differences and Monitoring Accountability
Revise the static topic: UPSC Environment notes
In short: During Delhi’s post-Deepavali pollution surge, an analysis cited by The Hindu found 227 missing hourly PM2.5 observations across 59 monitoring stations, raising concerns that peak pollution was understated. Differences between official and private AQI readings also reflect different calculation methods, making transparent concentration data, completeness disclosures and reliable health advisories essential.
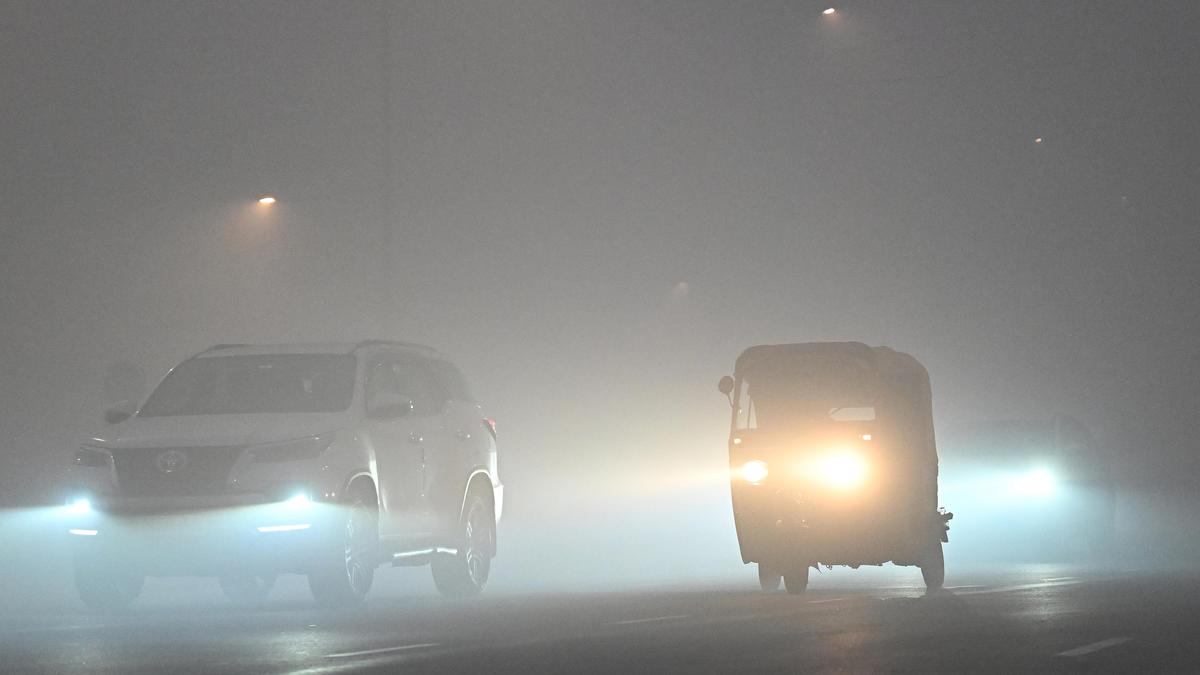
Photo from the source report: Delhi Pollution: PM2.5 Data Gaps, AQI Differences and Monitoring Accountability
Image: The Hindu
Why in news
Reports on November 9, 2026 documented missing pollution readings during the Deepavali episode and large differences between official and private AQI values. The Delhi government said it would examine the missing data; the supplied reports do not establish deliberate manipulation.
227
Missing hourly PM2.5 observations
59
Stations covered by the cited analysis
45
Stations with at least one missing observation
1,000 µg/m³
Reported PM2.5 measurement or display ceiling
500
Upper limit of official Indian AQI scale
15 µg/m³
WHO PM2.5 guideline for a 24-hour mean
Background
PM2.5 consists of fine particulate matter with a diameter of 2.5 micrometres or less. These particles can penetrate deep into the lungs and enter the bloodstream, increasing respiratory and cardiovascular risks. India’s National Air Quality Index translates pollutant concentrations into a public-facing health-risk indicator, while the Central Pollution Control Board supports pollution monitoring and regulatory coordination. In Delhi-NCR, the Commission for Air Quality Management coordinates air-quality management, including the Graded Response Action Plan. Winter pollution reflects emissions from multiple sources interacting with meteorological conditions that restrict dispersion.
What the missing observations establish
A Centre for Research on Energy and Clean Air analyst, cited by The Hindu, identified 227 missing hourly PM2.5 observations across 59 stations from midnight on November 8 to 5 a.m. on November 9. Only 14 stations had complete data. Gaps were reported at locations including Anand Vihar, Patparganj and Bawana.
The timing matters because missing high-pollution observations can bias an average downwards if the remaining readings disproportionately represent cleaner hours. However, missingness does not automatically prove a lower AQI in every case: the effect depends on which observations are absent, data-validity rules and the pollutant determining the final index. The magnitude of any understatement cannot be reconstructed from the supplied reports alone.
- Anand Vihar recorded PM2.5 of 767 µg/m³ before readings disappeared for the next three hours.
- Patparganj recorded PM2.5 of 930 µg/m³ before a similar gap.
- A blank on a public portal does not, by itself, establish that a monitoring station was deliberately shut down.
- Allegations of manipulation require examination of instrument records, transmission logs and publication procedures.
Infographic
Measure
Maintain calibrated monitors capable of characterising severe episodes.
Disclose
Publish concentrations, missing-data flags and over-range status.
Compare correctly
Align locations, averaging periods and AQI methods.
Protect health
Issue local advisories with explicit uncertainty warnings.
Enforce and reduce
Use evidence and forecasts for emergency action and sustained emission cuts.
AI-assisted infographic by Pragnya IAS Academy, based on the cited sources.
PM2.5 monitoring: distinguish missing data from measurement limits
Experts cited by The Hindu described a PM2.5 analyser range extending to 1,000 µg/m³, while the report observed an apparent ceiling at that level on the CPCB portal. An instrument’s measurement range, a portal’s display limit and an AQI scale’s upper limit are different constraints and require separate scrutiny.
If an instrument registers an over-range condition, the public display should identify it explicitly rather than present an unexplained blank. Where technically justified, a reading can be labelled as at least the instrument limit, but that lower bound must not be represented as an exact concentration. An ordinary outage cannot be assumed to indicate an exceedance.
- Separate instrument failure, communication failure, invalidated observations and over-range conditions in public reporting.
- Preserve raw observations and quality-control flags so that published values can be independently audited.
- Do not replace missing observations with zero or invent peak readings through undocumented estimation.
Why official and private AQI readings differ
India’s AQI converts pollutant concentrations into sub-indices using concentration breakpoints. The highest valid pollutant sub-index determines the overall AQI at a monitoring location; it is not the arithmetic average of all pollutant sub-indices. The official scale ends at 500, so further concentration increases need not produce a higher displayed index.
The Indian Express reported an official Delhi AQI of 370 on November 9 morning, compared with AQI.in readings of 955 under US standards and 787 under its Indian-standard calculation. Different breakpoints, averaging periods, locations, instruments and treatment of values beyond the official scale can generate different results. A private reading above 500 is therefore not directly comparable with the official Indian scale merely because it carries an Indian-standard label.
- AQI is an index without a concentration unit; PM2.5 concentration is expressed in µg/m³.
- Compare the same pollutant, location, time window and validated concentration before comparing index values.
- The maximum-sub-index rule concerns pollutants at a monitoring location; it should not be confused with aggregation across city stations.
- An hourly peak divided by WHO’s 24-hour guideline is not a like-for-like assessment of 24-hour exposure.
Reliable data are infrastructure for enforcement and health protection
Monitoring supports pollution-control inspections, emergency restrictions and public-health communication. The Indian Express reported that GRAP Stage III had been in force since November 6, based on forecasts of deterioration even though the city AQI was then in the very poor category. Stage IV had not been invoked as of November 9 morning, according to that report.
The Air (Prevention and Control of Pollution) Act provides the statutory framework for air-pollution control, while CAQM provides a regional coordination mechanism for Delhi-NCR. The judicial interpretation of Article 21 links environmental quality with the right to life; Articles 48A and 51A(g) reinforce environmental protection. These principles make trustworthy environmental information important to accountable administration.
- GRAP is not purely retrospective: authorities can act on forecasts of worsening conditions.
- City-level summaries should be accompanied by station-level advisories because local exposure can differ substantially.
- A monitoring outage during a known pollution episode should prompt explicit uncertainty warnings, not reassurance based on incomplete data.
Separate measurement accountability from source attribution
The episode generated competing political allegations about monitoring manipulation and crop-residue burning. The supplied reports establish missing observations and record these allegations, but do not establish intentional fraud or the contribution of any single source to the pollution peak.
Firecrackers add pollutants, including when certified as green crackers, but Delhi’s wider pollution problem also involves transport, construction dust, industry and seasonal crop-residue burning. Weak winds and atmospheric conditions restricting dispersion can intensify these emissions. Better monitoring and sustained source reduction must therefore proceed together.
- Use emissions inventories, meteorological analysis and source-apportionment evidence rather than political claims to assign contributions.
- Treat green crackers as lower-emission products, not pollution-free products.
- Combine episode-specific enforcement with year-round measures across the regional airshed.
| Concept | Meaning | Interpretation safeguard |
|---|---|---|
| PM2.5 concentration | Mass of fine particles per unit volume of air, expressed in µg/m³ | Specify location, averaging period and data validity. |
| Indian AQI | A health-communication index determined by the highest valid pollutant sub-index | The official scale ends at 500; this does not cap actual pollution. |
| Private-platform AQI | An index produced using the platform’s selected standards, observations and processing rules | Check breakpoints, averaging windows, spatial coverage and treatment of extreme values. |
| WHO PM2.5 guideline | A health-based concentration benchmark; the cited 24-hour value is 15 µg/m³ | Compare it with a 24-hour mean, not an isolated hourly peak; it is not itself an Indian statutory limit. |
| Instrument or portal ceiling | A limit on measurement or displayed concentration, reported here at 1,000 µg/m³ | Distinguish an over-range observation from a missing observation. |
- 1. Measure pollutant concentrations at representative monitoring locations.
- 2. Validate observations and flag outages, invalid values and over-range conditions.
- 3. Apply pollutant-specific averaging rules and convert concentrations into sub-indices.
- 4. Determine station AQI and publish concentration data, coverage and aggregation methods.
- 5. Combine observations with forecasts and local exposure information.
- 6. Issue health advisories and pollution-control directions, then audit implementation.
November 6, 2026
According to The Indian Express, GRAP Stage III came into force in Delhi-NCR as forecasts indicated worsening air quality.
November 8, 2026
Deepavali-night pollution rose sharply, with high PM2.5 readings followed by gaps at several stations.
November 9, 2026
Reports documented missing observations, conflicting AQI readings and political allegations; the Delhi government said it would examine the data gaps.
Significance, challenges & way forward
Significance
- Reliable monitoring enables authorities to identify pollution episodes and justify proportionate restrictions.
- Transparent concentration data allow independent scrutiny when index scales conceal the severity of extreme pollution.
- Local health advisories can better protect children, older persons, outdoor workers and people with existing illnesses.
- Credible public information strengthens trust and makes enforcement decisions more defensible.
Challenges
- Missing observations during peak hours can distort exposure assessment and undermine confidence in official summaries.
- Measurement ceilings and unexplained portal blanks can obscure extreme pollution without revealing the cause.
- Different index methods and spatial coverage make headline AQI comparisons misleading.
- City-level summaries can conceal neighbourhood hotspots and unequal exposure.
- Political allegations can distract from technical investigation and coordinated emission reduction.
Way forward
- Commission an independent technical audit of missing observations, instrument configurations, maintenance records and transmission logs.
- Publish station-wise completeness, calibration status, quality flags and explanations for outages alongside AQI readings.
- Disclose averaging, breakpoint, aggregation and extreme-value handling rules in an accessible methodology note.
- Review monitoring capability for extreme episodes and validate any changes to instrument range or measurement procedures.
- Provide precautionary, location-specific health advisories using validated observations and forecasts while explicitly stating uncertainty.
- Pair emergency GRAP restrictions with sustained controls on transport, dust, industrial emissions and crop-residue burning.
Key terms
- PM2.5
- Fine particulate matter with a diameter of 2.5 micrometres or less that can penetrate deep into the lungs.
- Air Quality Index
- A public-communication index that converts pollutant concentrations into an interpretable air-quality category.
- Breakpoint
- A specified concentration threshold used to translate pollutant measurements into index values and categories.
- Running average
- An average recalculated as the observation window advances, which smooths short-term fluctuations.
- Over-range observation
- An observation indicating that a concentration exceeds an instrument’s validated measurement range, without establishing the exact value.
- Data completeness
- The availability of valid observations relative to the observations expected for a specified period.
- GRAP
- The Graded Response Action Plan, a framework for progressively stronger pollution-control measures in Delhi-NCR.
- Source apportionment
- Scientific estimation of the contributions of different emission sources to measured pollution.
Link with static syllabus
Prelims practice MCQs
Q1. With reference to India’s Air Quality Index, consider the following statements: 1. Pollutant concentrations are converted into separate sub-indices using defined breakpoints. 2. The overall AQI at a monitoring location is the arithmetic mean of all pollutant sub-indices. 3. An AQI at the upper end of the official scale does not establish that pollutant concentrations have stopped increasing. Which of the statements given above are correct?
Q2. With reference to PM2.5 monitoring, consider the following statements: 1. A missing observation conclusively proves deliberate manipulation. 2. A single hourly PM2.5 reading establishes whether the WHO 24-hour guideline has been exceeded over the corresponding day. 3. An over-range observation should be distinguished from a communication outage. Which of the statements given above is/are correct?
Q3. Consider the following pairs: 1. CPCB: Pollution monitoring and regulatory coordination 2. CAQM: Air-quality management coordination in Delhi-NCR 3. WHO air-quality guidelines: Indian statutory ambient air-quality limits Which of the pairs given above are correctly matched?
Q4. Which of the following is the most scientifically sound first step when two platforms report substantially different AQI values for the same city?
Mains practice questions
GS 3 · 15 marks · 250 words
Reliable air-quality data are a prerequisite for effective pollution-control enforcement and public-health protection. Discuss with reference to monitoring gaps and differences in AQI methodologies.
Frequently asked questions
Does missing PM2.5 data prove that Delhi’s AQI was manipulated?
No. The reports establish missing observations and concerns about understatement, but determining deliberate manipulation requires an audit of instruments, transmission systems and publication records.
Why can private platforms show an AQI above 500 when India’s official scale ends there?
Platforms may use different breakpoints or extend calculations beyond the official scale. Their values must be compared using disclosed methods and underlying concentrations, not headline numbers alone.
Is a PM2.5 concentration of 1,000 µg/m³ the same as an AQI of 1,000?
No. PM2.5 concentration measures particle mass per volume of air, whereas AQI is a unitless index derived using a specified calculation method.
Must GRAP restrictions wait until the observed AQI crosses a threshold?
No. Authorities can invoke measures in advance based on forecasts of worsening air quality, as described in the supplied reporting on Stage III.
Sources
- The Hindu: At peak of air pollution on Deepavali, data goes missing at several government monitoring stations in Delhi
- The Hindu: Delhi AQI row: AAP alleges data fraud, BJP fires back over Punjab stubble ‘conspiracy’
- Indian Express: Delhi’s AQI is 370, but some platforms show 1,000: Why do readings differ?
- Times of India: Delhi pollution on Diwali rockets to worst in 5 years
Analysis prepared by the Pragnya IAS Academy current-affairs desk with AI assistance from the cited reports. Verify figures with the original sources.
Turn current affairs into marks
Join Pragnya IAS Academy's mentorship for daily answer-writing evaluation on stories like this — classroom programmes from a trusted name in IAS coaching in Hyderabad.