
Record Pacific Heat and El Niño: ENSO Dynamics, Forecast Risks and India’s Preparedness
Revise the static topic: UPSC Environment notes
In short: The Hindu reports record warmth in the equatorial Pacific and cites NOAA’s Climate Prediction Center as assigning an 83% likelihood to a strong-to-very-strong El Niño. It also reports a projected peak anomaly of 3.8°C for the 2026–27 event, but this remains a forecast rather than an observed record. For India, the concern is a potential disruption of rainfall and associated agricultural and water stress, not an inevitable nationwide drought.
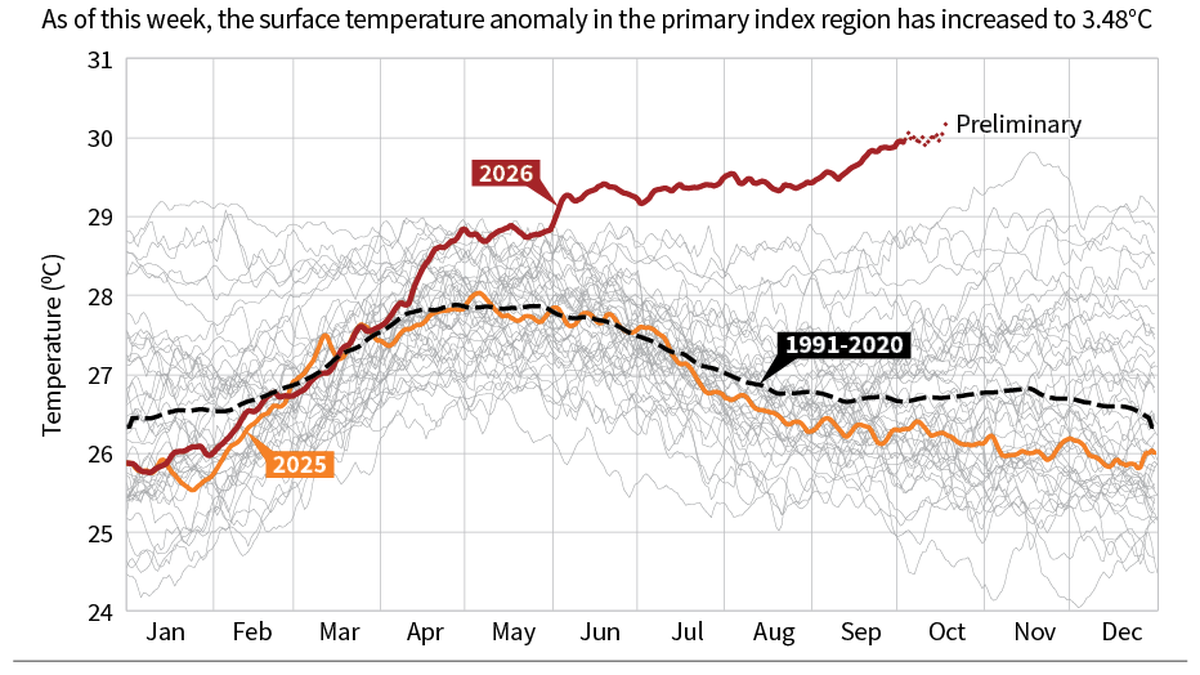
Record equatorial Pacific warmth raises concern about a strong El Niño. The reported 3.8°C peak anomaly for 2026–27 is a forecast, not an observed record; impacts on India’s monsoon remain uncertain.
Image: The Hindu
Why in news
The report says sea surface temperature in the Niño 3.4 region exceeded 30°C on October 5 for the first time in the recorded series. Exceptional Pacific warmth and forecasts of a powerful El Niño have renewed attention to climate risks and preparedness in India.
83%
Reported probability of strong-to-very-strong El Niño
3.8°C
Reported projected peak anomaly for 2026–27
Above 30°C
Reported Niño 3.4 temperature on October 5
2.6°C
Reported three-month anomaly in 2015–16
2.4°C
Reported three-month anomaly in 1997–98
2.1°C
Reported three-month anomaly in 1982–83
Background
The El Niño–Southern Oscillation, or ENSO, is a coupled ocean–atmosphere phenomenon in the tropical Pacific, with warm El Niño, cool La Niña and neutral phases. Under normal conditions, easterly trade winds push warm surface water towards the western Pacific, while upwelling brings colder water towards the surface in the eastern Pacific. This oceanic pattern is linked to the Walker circulation, involving rising air over the warmer western Pacific and sinking air farther east. El Niño alters these interacting oceanic and atmospheric conditions, influencing weather far beyond the Pacific through teleconnections.
What the report establishes—and what remains a forecast
The source reports exceptional daily warmth in Niño 3.4, a central-equatorial Pacific region used to monitor ENSO. It also reports a record average ocean surface temperature outside the polar regions of 21.18°C on August 22. These observations describe different geographical domains and should not be treated as interchangeable indicators.
The reported 83% probability refers to a strong-to-very-strong El Niño; it is not an 83% probability of an Indian drought or of the strongest El Niño on record. The projected 3.8°C peak is also not an observed temperature anomaly.
The excerpt does not specify the model, baseline or averaging period underlying the 3.8°C projection. A rigorous comparison with the historical three-month anomalies therefore requires consistent index definitions, reference periods and averaging windows.
- An absolute sea surface temperature is different from an anomaly measured against a climatological reference.
- A daily temperature record does not, by itself, establish the seasonal strength of ENSO.
- The supplied material supports concern and preparedness, but not certainty about a record-breaking outcome.
Infographic
Observed signal
Record Pacific warmth reported; daily temperatures are not seasonal ENSO strength.
Forecast caution
Strong-to-very-strong outlook is probabilistic; the projected peak is not observed.
Climate mechanism
Trade winds, ocean warming and Walker circulation interact.
Indian exposure
Rainfall variability can affect crops, reservoirs and groundwater demand.
Preparedness
Local advisories, contingency crops, water planning and multi-hazard readiness.
AI-assisted infographic by Pragnya IAS Academy, based on the cited sources.
How El Niño develops: ocean–atmosphere coupling
When Pacific trade winds weaken, the usual westward accumulation of warm surface water is reduced, allowing warm water to spread eastwards. The thermocline deepens in the eastern equatorial Pacific, limiting the cooling effect of upwelling. Central and eastern Pacific surface waters become warmer than usual.
The warming shifts tropical convection and changes the Walker circulation. These atmospheric changes can further weaken the trade winds, reinforcing the initial ocean warming through the Bjerknes feedback. El Niño is therefore not merely a patch of warm water: its evolution depends on sustained ocean–atmosphere interaction.
Changes in tropical heating influence distant atmospheric circulation. These teleconnections can alter rainfall, heat and storm patterns across regions, but their effects differ by location and season.
- Niño 3.4 is a monitoring region, not a separate ocean current.
- The Southern Oscillation is the atmospheric pressure component of ENSO.
- La Niña generally involves stronger trade winds and cooler central and eastern equatorial Pacific waters.
Why exceptional ocean heat does not remove forecast uncertainty
Ocean heat can provide favourable conditions for El Niño development, but the eventual strength depends on subsurface heat distribution, winds and the persistence of atmospheric coupling. Short-lived weather disturbances can modify the trajectory, while models differ in their representation of these processes.
Forecasts also depend on lead time and season. ENSO prediction is particularly challenging across the boreal spring predictability barrier. A forecast of peak Pacific warming and a forecast of rainfall over an Indian district are different prediction problems; the latter additionally requires translating a large-scale climate signal into regional impacts.
Human-induced warming raises the background temperature on which ENSO operates, but ENSO remains a natural mode of climate variability. The supplied excerpt does not quantify the contribution of climate change to this particular event, so a specific attribution claim would be unwarranted.
- Use ensemble forecasts and their uncertainty ranges rather than a single model’s peak estimate.
- Track official updates as ocean and atmospheric observations evolve.
- Assess the timing and persistence of the event before inferring consequences for a particular Indian rainfall season.
India’s exposure: monsoon, agriculture, water and disasters
El Niño is often associated with a weaker Indian southwest monsoon through changes in large-scale atmospheric circulation. The relationship is probabilistic, not deterministic: the Indian Ocean Dipole, intraseasonal variability and regional weather systems can modify the outcome. The seasonality also matters because El Niño can favour rainfall over parts of southern India during the northeast monsoon.
For agriculture, rainfall distribution can matter as much as the seasonal total. Delayed sowing, prolonged dry spells and moisture stress during sensitive crop stages can reduce yields and increase irrigation demand. Rainfed farmers, livestock-dependent households and areas with limited irrigation flexibility face particular exposure.
Reduced catchment inflows can intensify competition among drinking water, irrigation, hydropower and ecological requirements. Yet a season with deficient overall rainfall can still contain damaging heavy-rainfall episodes. Preparedness must therefore address heat and drought without weakening flood readiness.
- Do not translate Pacific warming directly into a uniform all-India rainfall deficit.
- Distinguish southwest monsoon risks from northeast monsoon responses.
- Combine climate forecasts with district rainfall, soil moisture, reservoir storage and crop-stage information.
- Treat rainfall deficits, agricultural stress and water-supply shortages as related but distinct risks.
| Indicator | What the source reports | Interpretation and limitation |
|---|---|---|
| Niño 3.4 absolute temperature | Exceeded 30°C on October 5 | A reported temperature observation; not itself the ENSO anomaly or seasonal classification. |
| El Niño strength probability | 83% likelihood of strong-to-very-strong conditions, attributed to NOAA’s Climate Prediction Center | A probabilistic strength outlook; not a forecast probability of drought in India. |
| Projected peak | 3.8°C anomaly for 2026–27 | A forecast; its model basis and averaging period are not specified in the excerpt. |
| Historical strong events | Three-month anomalies of 2.1°C in 1982–83, 2.4°C in 1997–98 and 2.6°C in 2015–16 | Historical comparators reported by the source; valid comparison requires consistent measurement conventions. |
- 1. Pacific trade winds weaken, reducing the westward concentration of warm surface water.
- 2. Warm water spreads eastwards and reduced cooling from upwelling favours central and eastern Pacific warming.
- 3. Tropical convection and the Walker circulation shift, potentially reinforcing the warming.
- 4. Atmospheric teleconnections alter regional circulation and rainfall probabilities.
- 5. Indian rainfall outcomes depend on the event’s timing, Indian Ocean conditions and regional variability.
- 6. Local exposure and preparedness determine the consequences for crops, water supplies and disaster losses.
1982–83
The source identifies a very strong El Niño with a three-month temperature anomaly of 2.1°C.
1997–98
The source reports a very strong El Niño with a three-month temperature anomaly of 2.4°C.
2015–16
The source reports a very strong El Niño with a three-month temperature anomaly of 2.6°C.
2026–27 outlook
The report projects a peak anomaly of 3.8°C; this is a forecast, not an observed historical outcome.
Significance, challenges & way forward
Significance
- ENSO monitoring provides advance information that can support agricultural, water-management and disaster-preparedness decisions.
- A powerful El Niño can add to heat risks against an already warmer climatic background.
- India’s rainfed agriculture and rainfall-dependent water resources make climate-informed planning especially important.
- The episode illustrates why policymakers must distinguish observed records, probabilistic forecasts and local impact assessments.
Challenges
- The supplied excerpt does not provide enough methodological detail to independently assess the projected 3.8°C peak.
- A strong Pacific signal does not translate into a uniform or certain rainfall response across India.
- Seasonal rainfall totals can conceal damaging dry spells and short-duration extreme rainfall.
- Forecast information may not reach vulnerable farmers and local administrations in an actionable form.
- Groundwater dependence can temporarily buffer rainfall deficits while increasing longer-term water stress.
- Overstating forecast certainty can undermine trust, while waiting for certainty can delay low-regret preparedness.
Way forward
- Use updated IMD assessments alongside international ENSO outlooks, clearly communicating probabilities, forecast periods and uncertainty.
- Prepare district-level crop contingency plans with locally appropriate sowing advice, crop choices, seed availability and protective irrigation.
- Review reservoir operations using catchment conditions, likely inflows and competing requirements, while prioritising drinking-water security.
- Integrate rainfall, soil moisture, groundwater, reservoir and crop-condition monitoring to identify emerging stress early.
- Strengthen heat-health action, livestock water provision and worker protection while maintaining flood and cyclone preparedness.
- Link advisories to extension services, local-language communication and existing insurance and relief mechanisms.
- Use staged preparedness triggers so that action intensifies as forecast confidence and observed local stress increase.
Key terms
- ENSO
- A coupled tropical Pacific ocean–atmosphere phenomenon encompassing El Niño, La Niña and neutral conditions.
- Niño 3.4
- A central-equatorial Pacific monitoring region whose sea surface temperature anomalies are widely used to assess ENSO.
- Sea surface temperature anomaly
- The departure of sea surface temperature from a reference climatological average for the relevant place and time.
- Walker circulation
- An east–west tropical atmospheric circulation linked to differences in ocean temperature, convection and surface pressure.
- Thermocline
- The ocean layer in which temperature decreases rapidly with depth.
- Bjerknes feedback
- A reinforcing interaction among Pacific temperature contrasts, trade winds and ocean conditions that helps ENSO develop.
- Teleconnection
- A climatic linkage through which conditions in one region influence weather or climate in a distant region.
- Indian Ocean Dipole
- A pattern of contrasting sea surface temperature anomalies in the western and eastern equatorial Indian Ocean that can influence regional rainfall.
Link with static syllabus
Prelims practice MCQs
Q1. With reference to El Niño, consider the following statements: 1. It involves interactions between the tropical Pacific Ocean and the atmosphere. 2. Weakening trade winds can favour its development. 3. It necessarily causes drought throughout India. Which of the statements given above are correct?
Q2. A reported probability of 83% for a strong-to-very-strong El Niño should be interpreted as which of the following?
Q3. Consider the following pairs: 1. Niño 3.4: An equatorial Pacific region used for ENSO monitoring 2. Southern Oscillation: The atmospheric pressure component of ENSO 3. Thermocline: A layer defined by rapidly increasing ocean salinity Which of the pairs given above are correctly matched?
Q4. Consider the following statements about climate observations and forecasts: 1. An absolute sea surface temperature and a temperature anomaly represent different quantities. 2. A daily temperature record is sufficient to establish the seasonal strength of ENSO. 3. Comparing projected and historical anomalies requires attention to their baselines and averaging periods. Which of the statements given above are correct?
Mains practice questions
GS 3 · 15 marks · 250 words
An exceptionally strong El Niño is a warning signal, not a deterministic forecast of drought in India. Explain and suggest a preparedness strategy for agriculture and water security.
Frequently asked questions
Has the 2026–27 El Niño already become the strongest on record?
The supplied material does not establish that. It reports exceptional temperatures and a projected peak anomaly, but a forecast cannot be treated as an observed record.
Does a very strong El Niño guarantee drought in India?
No. El Niño often raises the risk of a weaker southwest monsoon, but Indian Ocean conditions, regional variability and the event’s timing influence the actual outcome.
Why is a temperature above 30°C different from a 3.8°C anomaly?
The former is an absolute sea surface temperature; the latter is a departure from a reference average. The reported values also concern an observation and a projection, respectively.
What should India do before the forecast becomes certain?
Strengthen local climate advisories, crop contingency planning, water monitoring and heat preparedness. These low-regret measures should be scaled using updated forecasts and observed stress.
Sources
Analysis prepared by the Pragnya IAS Academy current-affairs desk with AI assistance from the cited reports. Verify figures with the original sources.
Turn current affairs into marks
Join Pragnya IAS Academy's mentorship for daily answer-writing evaluation on stories like this — classroom programmes from a trusted name in IAS coaching in Hyderabad.