
InfoGraphix by Pragnya · Geography · Chapter 8
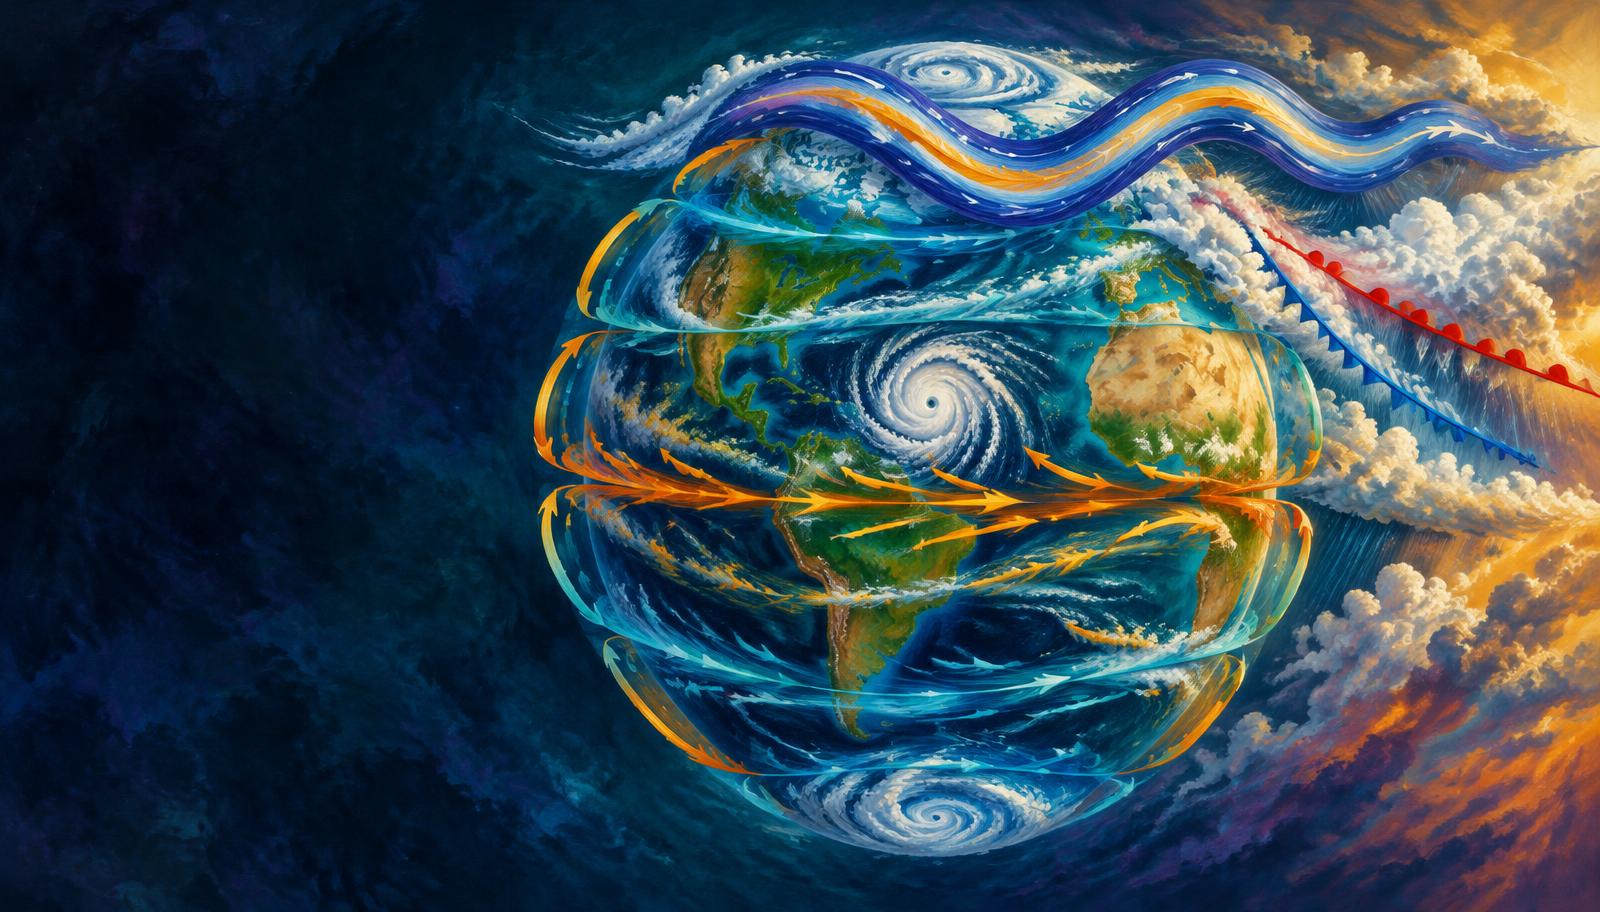
Atmospheric Circulation and Weather Systems
Trace how pressure and rotation organise global winds, jets and weather systems. Apply the mechanisms to Indian monsoons, winter rain and coastal cyclone risk.
- 18 visual topics
- 54 practice MCQs
- 54 flip cards
Three scales of atmospheric motion
Topics 1–6
Forces and global circulation
Pressure measurements, force balances, pressure belts, cells and planetary winds.
Topics 7–12
Regional and synoptic weather
Periodic and local winds, jet streams, air masses and fronts.
Topics 13–18
Storms and Indian applications
Tropical and extratropical cyclones, teleconnections, hazards and revision.
From pressure differences to resilient coasts
Scroll the ribbon and tap any milestone to open its infographic.
Measure
Atmospheric Pressure and Isobars
Read pressure before interpreting the wind.
Open topic →Accelerate
Forces Affecting Wind
Combine gradient, rotation and drag.
Open topic →Organise
Global Pressure Belts and Their Migration
Locate the global pressure zones and their shifts.
Open topic →Transport
Trades, Westerlies and Polar Easterlies
Trace planetary surface wind belts.
Open topic →Reverse
Periodic Winds: Daily and Seasonal Reversal
Explain daily and seasonal circulation changes.
Open topic →Steer
Jet Streams and Indian Weather
Use upper-air flow to connect distant weather.
Open topic →Lift
Fronts and Their Weather
Compare fronts and precipitation mechanisms.
Open topic →Intensify
Tropical Cyclones: Formation and Structure
Assemble the conditions for a warm-core vortex.
Open topic →Protect
Cyclone Risk and Coastal Resilience
Convert forecasts into reduced losses.
Open topic →
Topic index
Follow the numbers in order, or jump to what you need.
0 of 18 revised on this device
- 1Foundations
Atmospheric Pressure and Isobars
Read the weight of air on a weather map
Atmospheric pressure measures the force of the overlying air column per unit area. Its vertical decrease and horizontal differences provide the starting point for understanding winds.
Open infographic - 2Dynamics
Forces Affecting Wind
Pressure gradient, rotation and surface drag
Wind responds to pressure-gradient acceleration, the Coriolis effect and friction. Their relative strengths explain why real winds neither blow straight into every low nor follow isobars everywhere.
Open infographic - 3Dynamics
Geostrophic Flow, Cyclones and Anticyclones
Parallel aloft, inward across isobars below
Geostrophic flow approximates a balance between pressure-gradient and Coriolis forces away from the Equator. Curvature and friction modify that ideal and explain circulation around highs and lows.
Open infographic - 4Global circulation
Global Pressure Belts and Their Migration
Seven idealised belts, not fixed rings
The zonal-mean pressure pattern alternates between equatorial low, subtropical highs, subpolar lows and polar highs. Land–sea contrasts and seasonal heating make these ideal belts uneven and mobile.
Open infographic - 5Global circulation
Hadley, Ferrel and Polar Cells
Three cells per hemisphere redistribute heat
The three-cell model organises atmospheric overturning into tropical, middle-latitude and polar cells. It explains broad wind belts while leaving room for eddies, seasonal changes and regional monsoons.
Open infographic - 6Global circulation
Trades, Westerlies and Polar Easterlies
Name winds by where they come from
Planetary winds are the broad surface wind belts arising from pressure differences and rotation. Their names record their source direction, not the direction toward which they travel.
Open infographic - 7Periodic winds
Periodic Winds: Daily and Seasonal Reversal
Breezes, slope winds and the monsoon
Periodic winds reverse as heating contrasts change over a day or a season. Sea–land breezes, slope circulations and the monsoon operate at very different spatial and temporal scales.
Open infographic - 8Local weather
Indian Local Winds and Pre-monsoon Storms
Loo, nor’westers and crop-linked showers
India’s hot season produces both dry heat-bearing winds and local convective storms. These are distinct phenomena even though examination lists often group them under local winds.
Open infographic - 9Local weather
World Local Winds: A Regional Atlas
Warm descents, cold outflows and dust
Local wind names encode regional geography and thermal character. Classify each by source region and process before memorising an associated hazard or nickname.
Open infographic - 10Upper atmosphere
Jet Streams and Indian Weather
Upper-air currents link distant weather
Jet streams are narrow zones of strong winds near the tropopause. Subtropical and polar jets are mainly westerly, whereas the tropical easterly jet is an important summer exception.
Open infographic - 11Synoptic weather
Air Masses and Source Regions
Read c/m and T/P/A as two separate clues
An air mass is a large volume of air with broadly similar temperature and moisture characteristics horizontally. Those properties reflect its source surface and subsequent modification along its path.
Open infographic - 12Synoptic weather
Fronts and Their Weather
Cold, warm, stationary and occluded
A front is a transition zone between contrasting air masses. Frontal slope, motion, moisture and stability help explain why some fronts bring steady rain and others sharp showers or thunderstorms.
Open infographic - 13Cyclones
Tropical Cyclones: Formation and Structure
Warm seas, organised ascent and rotation
Tropical cyclones are organised warm-core low-pressure systems powered by ocean heat and latent heat release. Formation needs several favourable conditions together, not warm sea-surface temperature alone.
Open infographic - 14India focus
Indian Cyclones, Tracks and Naming
Bay frequency, Arabian risk and RSMC New Delhi
The Bay of Bengal has historically generated more North Indian Ocean cyclones than the Arabian Sea. Basin frequency, maximum storm intensity, coastal exposure and naming rules must be treated as separate issues.
Open infographic - 15Cyclones
Temperate Cyclones and Western Disturbances
Frontal storms, eastward travel and rabi rain
Extratropical cyclones develop mainly in zones of strong horizontal temperature contrast and interact with upper-level waves. Western disturbances are eastward-moving systems in the subtropical westerly flow that affect northern India.
Open infographic - 16Weather connections
ENSO, IOD, Thunderstorms and Tornadoes
Separate climate influences from local storm types
ENSO and the Indian Ocean Dipole alter the large-scale background in which Indian weather develops. Thunderstorms and tornadoes are shorter-lived convective phenomena and should not be confused with oceanic tropical cyclones.
Open infographic - 17Disaster management
Cyclone Risk and Coastal Resilience
From accurate warning to safe last-mile action
Cyclone losses arise from wind, coastal inundation, heavy rain and cascading infrastructure failures. Effective risk reduction combines forecasts with evacuation, resilient settlements and sustained ecosystem protection.
Open infographic - 18Revision
Chapter Quick Revision
Numbers, contrasts, traps and a Mains frame
Revise atmospheric circulation as a chain from pressure differences to wind, organised circulation and storm hazards. Link the global framework to Indian monsoons, western disturbances and cyclone preparedness.
Open infographic
Full reading notes in the Study Library
- Pressure belts →
- Coriolis force →
- Planetary winds →
- Anticyclones →
- Monsoon mechanism →
- Local winds →
- Jet streams →
- Western Disturbances →
- Air masses →
- Fronts →
- Tropical cyclones →
- Coastal Plains →
- Temperate cyclones →
- ENSO →
- Indian Ocean Dipole →
- El Nino →
- Coastal processes →
- Floods →