
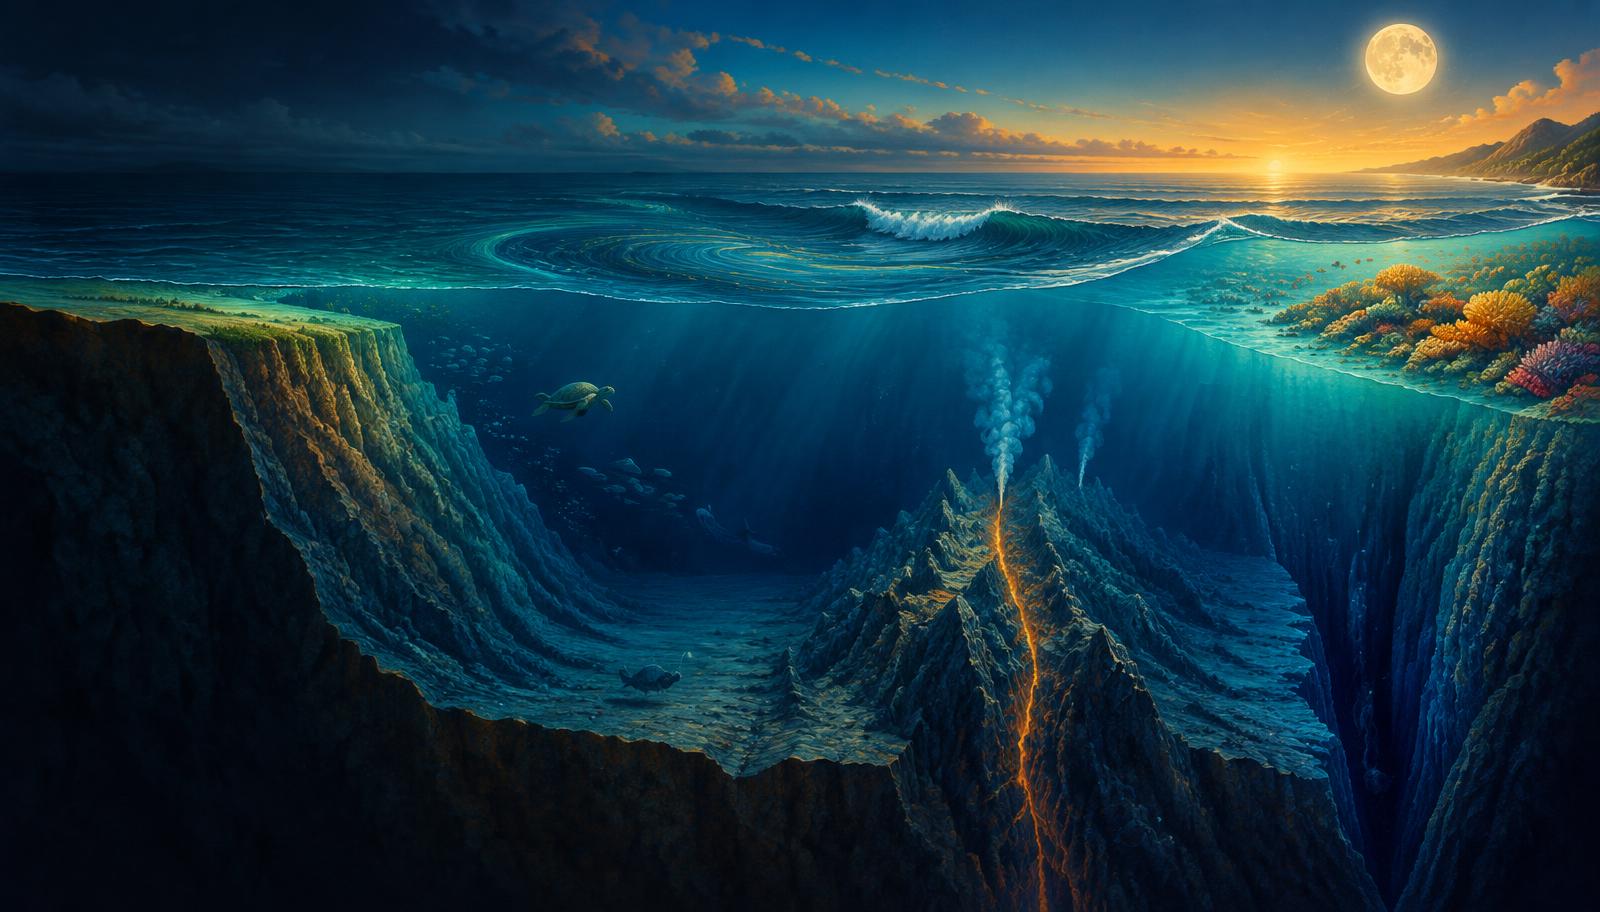
InfoGraphix by Pragnya · Geography · Chapter 11
Oceans: Relief, Temperature, Salinity and Movements
Read the ocean from its submerged margins to its global circulation. Connect temperature, salinity, waves, tides and currents with Indian coastal livelihoods and emerging ocean governance.
- 18 visual topics
- 54 practice MCQs
- 54 flip cards
Three connected ocean systems
Topics 1–6
Relief and physical structure
Map continental margins, deep basins and reefs, then explain surface heating and vertical temperature structure.
Topics 7–12
Properties and movement
Follow salinity budgets into waves, tides and the forces organising ocean currents.
Topics 13–18
Connected oceans and governance
Trace world and Indian currents, fisheries, overturning, coral stress, acidification and governance.
From the seafloor to ocean stewardship
Scroll the ribbon and tap any milestone to open its infographic.
Map
Ocean Floor: From Margin to Basin
Read the submerged landscape
Open topic →Plate edges
Abyssal Plains, Ridges and Trenches
Spreading versus subduction
Open topic →Reefs
Seamounts, Guyots and Coral Reef Forms
Rock foundations and living structures
Open topic →Layers
Vertical Structure: Thermocline and Density
Mixed layer to deep water
Open topic →Freshwater
Global Salinity Patterns and Indian Seas
Subtropics, river plumes and enclosed basins
Open topic →Energy
Waves, Shoaling and Tsunamis
Energy transfer is not bulk transport
Open topic →Alignment
Spring–Neap Cycle and Indian Tidal Sites
Alignment, range and coastal use
Open topic →Monsoon
Indian Ocean: Monsoon Currents and Barrier Layers
Seasonal reversal and coastal implications
Open topic →Governance
Acidification, Deep-Sea Mining and BBNJ
Science, resources and ocean governance
Open topic →
Topic index
Follow the numbers in order, or jump to what you need.
0 of 18 revised on this device
- 1Relief
Ocean Floor: From Margin to Basin
Read the submerged landscape
Ocean basins combine submerged continental margins with deep plains, volcanic ridges and subduction trenches. Relief governs sediment storage, habitats and access to marine resources.
Open infographic - 2Relief
Shelf, Slope, Rise and Submarine Canyons
Resources and sediment pathways
The continental margin links terrestrial erosion to deep-ocean deposition. Shelves support major fisheries and offshore hydrocarbons, while canyons channel sediment downslope.
Open infographic - 3Relief
Abyssal Plains, Ridges and Trenches
Spreading versus subduction
Deep-ocean relief records plate creation, sediment blanketing and plate destruction. The abyssal plain, ridge and trench therefore require different explanations rather than a single depth-based classification.
Open infographic - 4Relief
Seamounts, Guyots and Coral Reef Forms
Rock foundations and living structures
Seamounts and guyots are volcanic relief features, whereas reefs are biological constructions. Reef position relative to land and lagoons distinguishes fringing reefs, barrier reefs and atolls.
Open infographic - 5Water properties
Surface Ocean Temperature and Its Controls
Latitude, winds, currents and seasons
Surface temperature reflects the balance of solar heating, heat loss, mixing and horizontal transport. Latitude supplies a broad pattern, while winds, currents and enclosed-basin conditions produce strong departures.
Open infographic - 6Water properties
Vertical Structure: Thermocline and Density
Mixed layer to deep water
The ocean is vertically layered because solar heating is strongest near the surface and mixing is uneven. Temperature and salinity together control density, stratification and the exchange of heat and nutrients.
Open infographic - 7Water properties
Salinity: Meaning, Budget and Gradients
Follow freshwater to understand salt
Salinity describes dissolved salts, with typical ocean water containing about 35 g of salts per kg. Surface salinity responds strongly to freshwater gains and losses, while circulation redistributes the resulting contrasts.
Open infographic - 8Water properties
Global Salinity Patterns and Indian Seas
Subtropics, river plumes and enclosed basins
Subtropical evaporation belts generally have high surface salinity, while rainy equatorial and river-influenced regions are fresher. India’s two adjoining seas show how runoff and evaporation can override simple latitude rules.
Open infographic - 9Movements
Waves, Shoaling and Tsunamis
Energy transfer is not bulk transport
Most everyday sea waves gain energy from wind, whereas tsunamis originate in rapid displacement of a large water volume. Both transform in shallow water, but their wavelengths, speeds and hazards differ greatly.
Open infographic - 10Movements
Tides: Forces and Daily Patterns
Lunar forcing and coastal response
Tides are long-period sea-level oscillations driven by differential lunar and solar gravity. Local basin shape, depth, rotation and resonance determine how the astronomical forcing appears at a particular coast.
Open infographic - 11Movements
Spring–Neap Cycle and Indian Tidal Sites
Alignment, range and coastal use
The relative positions of the Sun and Moon change tidal range through the month. Large tidal ranges aid some port operations and offer energy potential, but ecological and sedimentary costs constrain projects.
Open infographic - 12Movements
Ocean Currents: Drivers, Gyres and Boundaries
Wind stress, rotation and pressure
Surface currents emerge from wind stress, pressure gradients, rotation and continental barriers. Differential heating supplies energy and density contrasts, while Coriolis deflects motion rather than initiating it.
Open infographic - 13Movements
World Current Map: Warm and Cold Pathways
Trace currents along ocean margins
Current names become easier to retain when organised by basin and ocean boundary. Warm and cold describe temperature relative to surrounding waters, not an absolute temperature threshold.
Open infographic - 14Movements
Indian Ocean: Monsoon Currents and Barrier Layers
Seasonal reversal and coastal implications
The northern Indian Ocean differs from other basins because monsoon winds reverse seasonally and land blocks a northern oceanic extension. Freshwater layering in the Bay of Bengal further modifies mixing and cyclone–ocean interaction.
Open infographic - 15Ocean systems
Upwelling, Fishing Grounds and Coastal Climate
Nutrients connect circulation to livelihoods
Circulation shapes marine productivity by moving nutrients and creating fronts, not merely by mixing warm and cold water. Cold coastal currents also influence aridity, fog, navigation and the distribution of fish stocks.
Open infographic - 16Ocean systems
Deep Circulation, Warming and Coral Stress
Heat storage, overturning and bleaching
Density-driven overturning links surface heat exchange to the deep ocean, while wind and mixing help complete the circulation. Ocean warming and marine heatwaves stress ecosystems and can trigger mass coral bleaching.
Open infographic - 17Governance
Acidification, Deep-Sea Mining and BBNJ
Science, resources and ocean governance
Ocean governance must address chemical change, fragile deep-sea habitats and shared biodiversity. UNCLOS, the BBNJ Agreement and seabed institutions have connected but distinct mandates.
Open infographic - 18Revision
Chapter Quick Revision
Numbers, distinctions and an answer plan
Revise the ocean as a connected system: relief shapes habitats, water properties govern stratification and circulation redistributes heat and nutrients. Link every process to an Indian example and a governance or livelihood implication.
Open infographic
Full reading notes in the Study Library
- Ocean floor →
- Plate tectonics →
- Marine resources →
- Sea-floor spreading →
- Coral reefs →
- Ocean temperature →
- Insolation →
- Thermohaline circulation →
- Ocean salinity →
- Peninsular rivers →
- Waves →
- Coastal processes →
- Tides →
- Ports →
- Ocean currents →
- Coriolis force →
- Planetary winds →
- Monsoon mechanism →
- Tropical cyclones →
- Upwelling →
- Fisheries →
- El Nino impacts →
- Sea-level rise →